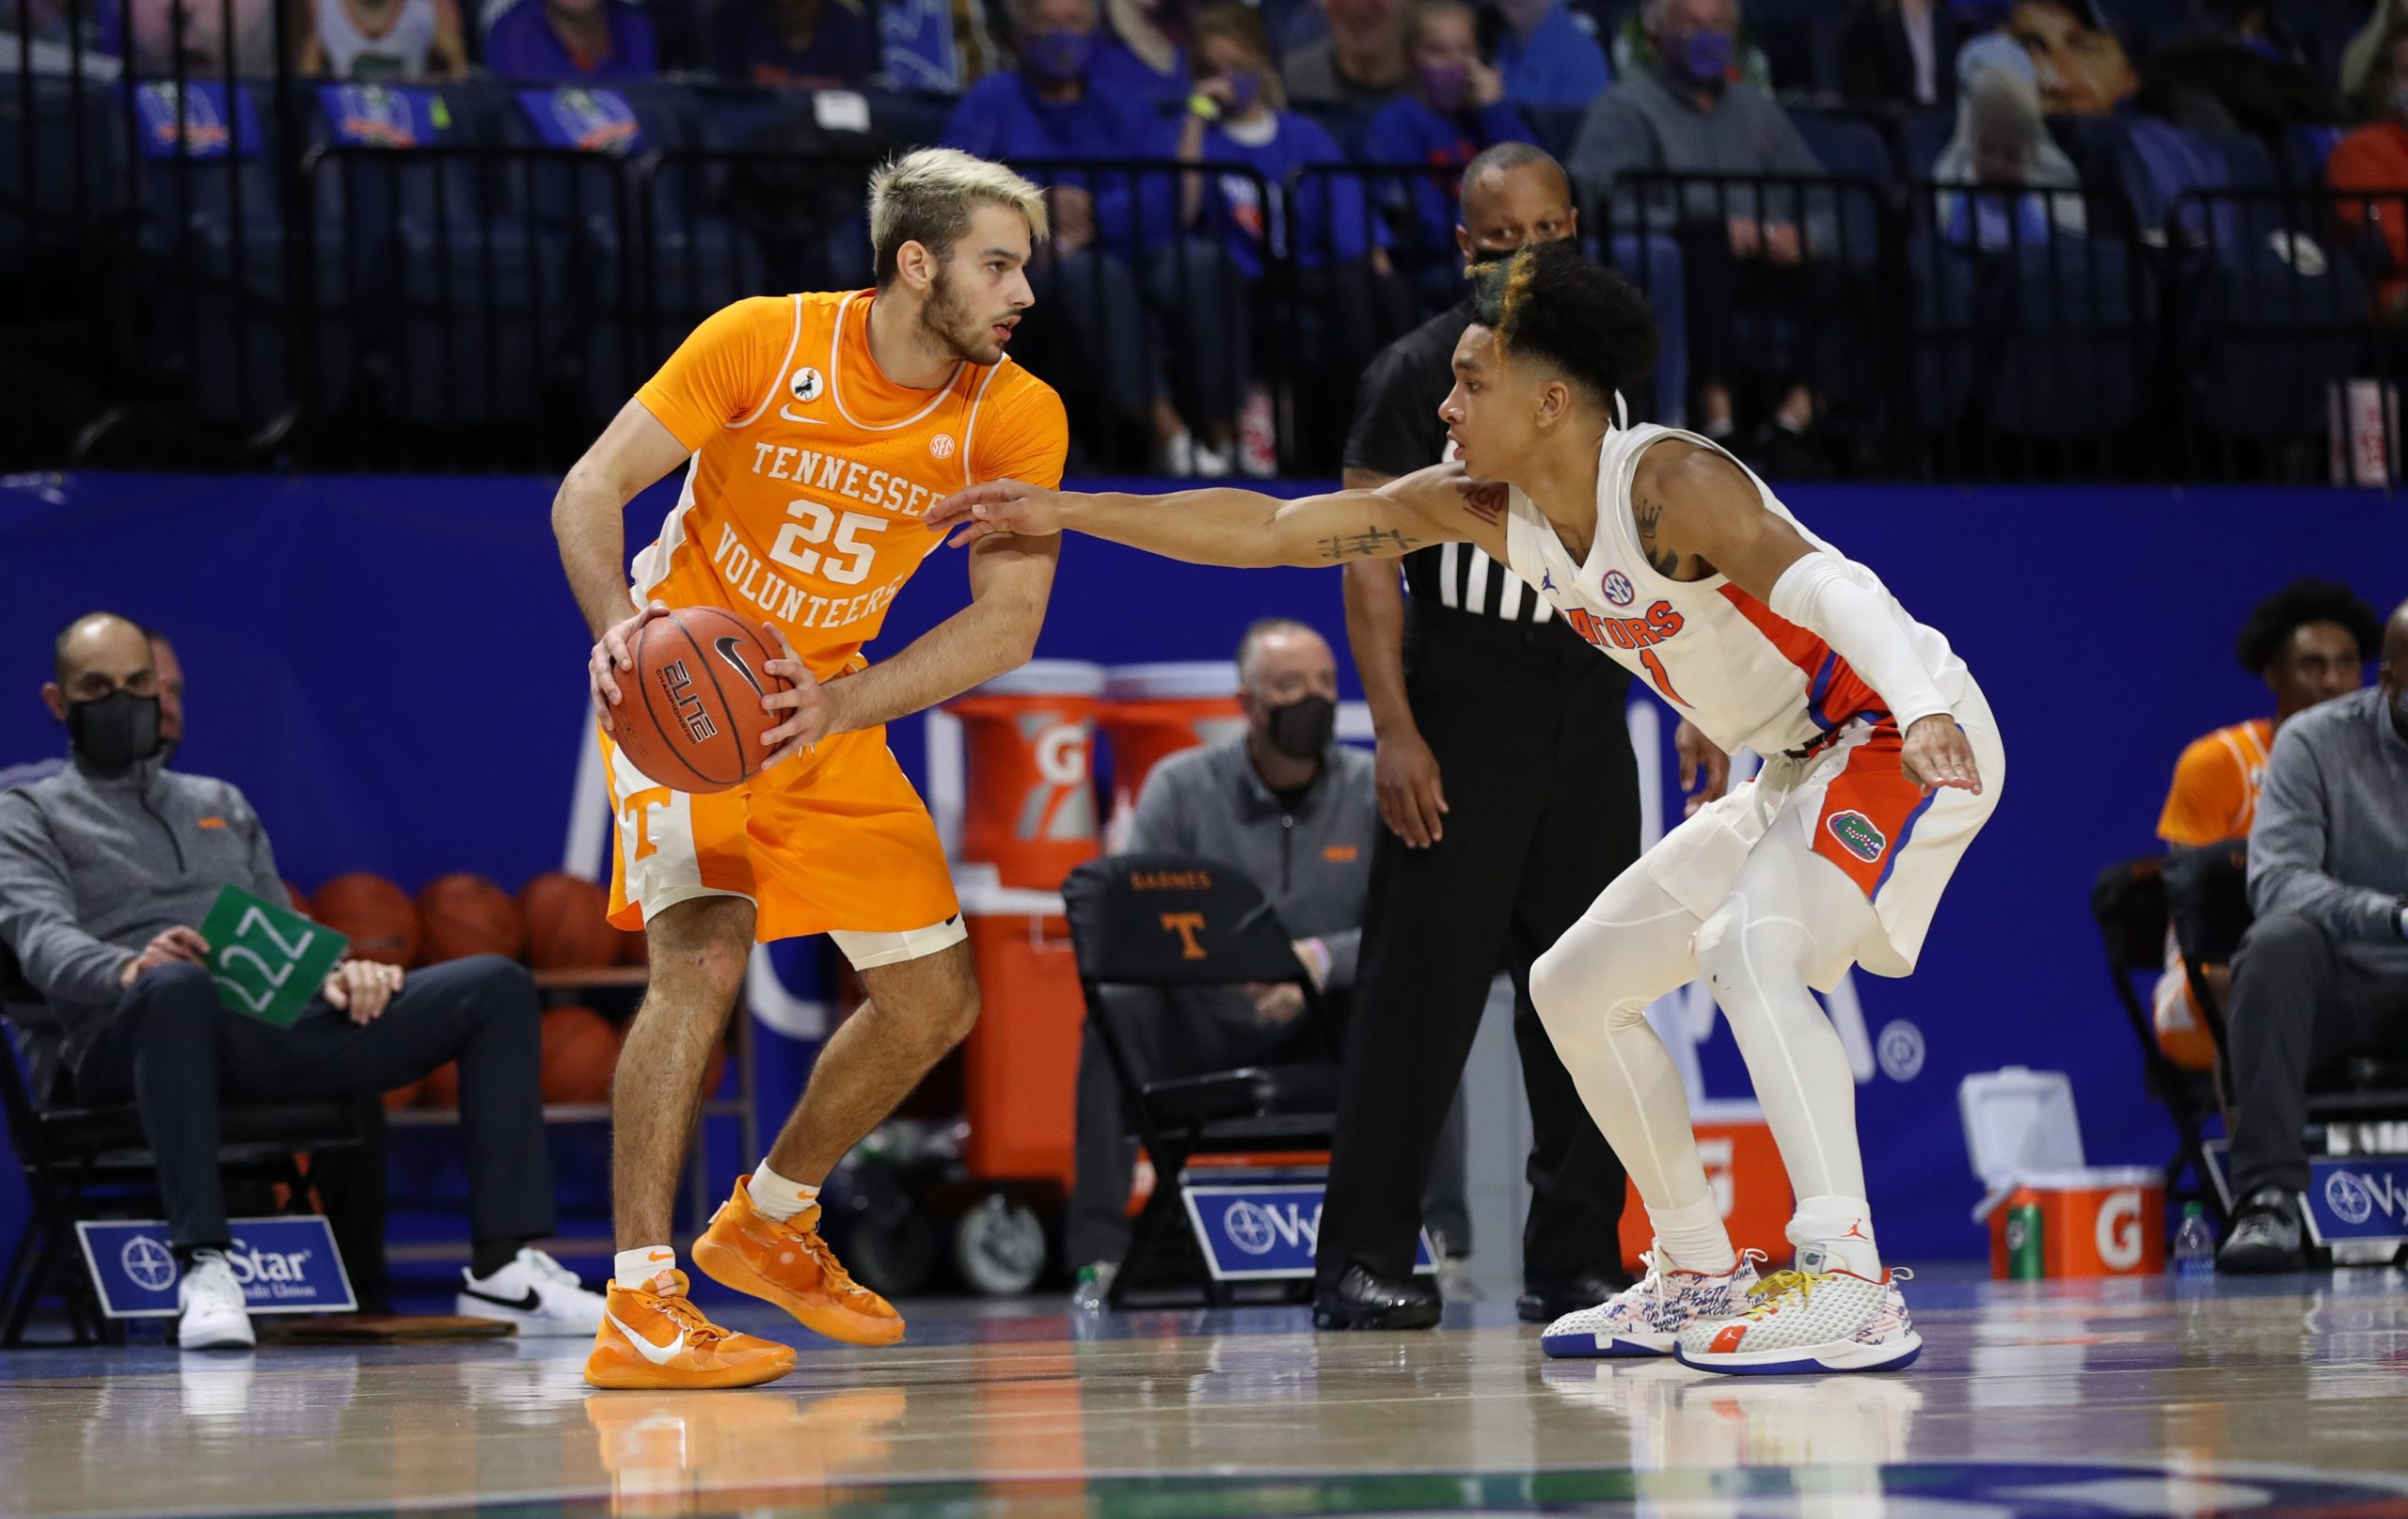
If you were looking for a pick-me-up this week with all the football drama, the basketball trip to Gainesville was not it. Maybe fewer of us were looking with all the football stuff going on. Either way, the Vols get another shot against a good team tomorrow night, as Missouri comes to Knoxville for the return match.
I wouldn’t expect another 20-point blowout; both Missouri and Tennessee were woeful at the free throw line the first time, so the game could go lots of different ways. And we’re unsure about the status of Jaden Springer, who continues to be Tennessee’s most productive option offensively on a per-minute basis.
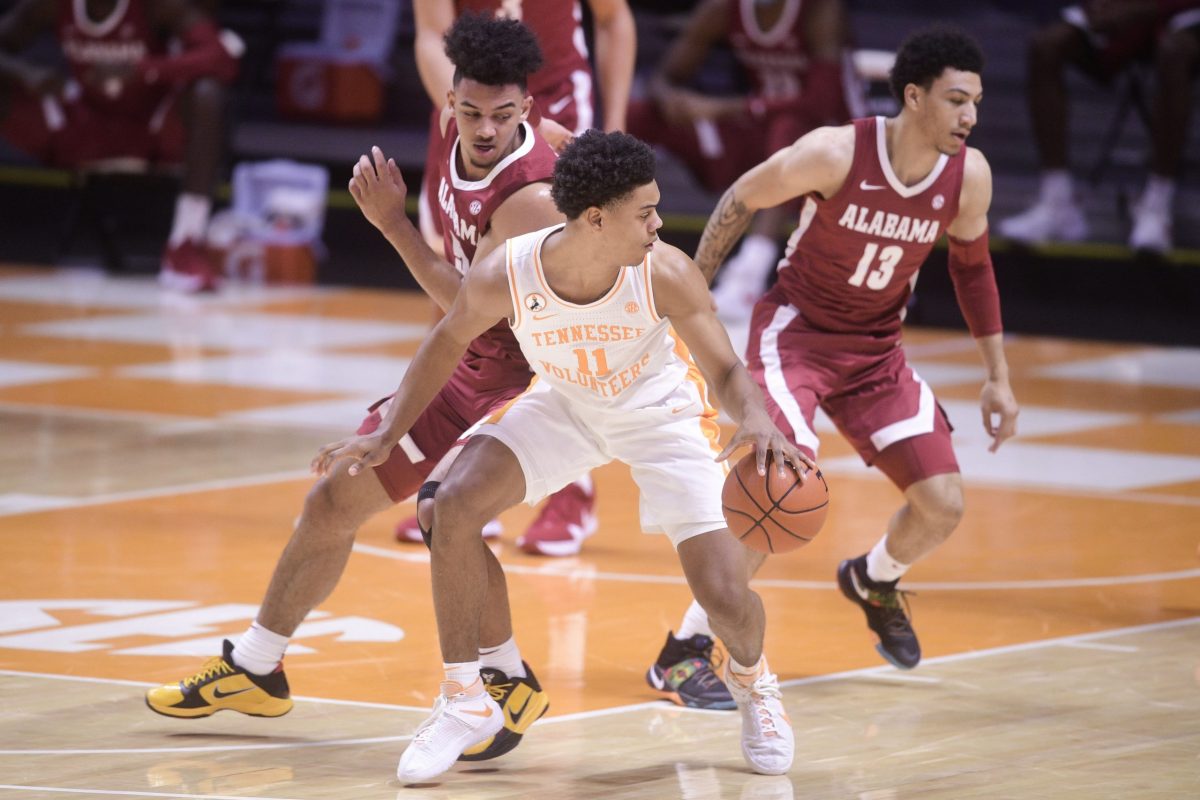
What went wrong in Gainesville was similar to what went wrong against Alabama from a lineup perspective: Springer was hurt and Pons got two fouls early. In terms of efficiency, those are Tennessee’s best players on offense and defense. Unlike the battle with the Tide, the Vols never got back within striking distance in the second half against the Gators.
Tennessee’s defense is still second in the nation. When Pons is on the floor, it’s elite. I’m not worried about that part.
But Tennessee’s offense plummeted to 54th nationally in KenPom. It’s not a death sentence – the 2010 Elite Eight Vols finished 75th, though they played much of the SEC calendar at less than full strength – but it needs to improve if the Vols are going to get back into the conversation for the bracket’s top line. In that regard, the Vols were passed by Alabama in the span of about four hours Tuesday night: a 26-point loss in Gainesville followed by a 30-point win for Bama in Baton Rouge, and now the Tide are the SEC’s best team by any metric you’d like. And because of some scheduling advantages the rest of the way home, KenPom projects the Tide to finish a blistering 16-2 in league play, with the Vols at 13-5. We’ll see about all of that, but if you want to have that conversation, Tennessee needs to figure out its offense.
The four factor numbers aren’t bad: 21st in turnovers, 50th in offensive rebounding percentage, 52nd in free throw rate. Much of Tennessee’s struggle has been the old Cuonzo Martin frustration: “We didn’t make shots.”
Tennessee’s offense is still based in getting good shots through good ball movement. It’s not as white-hot in this department as it’s been the last three years; the Vols were fourth nationally in assist rate last season, it’s not purely a product of having Grant Williams and Admiral Schofield on your team. Tennessee is currently 47th nationally in that stat, but just 156th in effective field goal percentage. Hard to get assists when the shots won’t fall.
So if we like most of the looks, but want to do more than just hope for the law of averages, how can Tennessee get their most productive scorers more opportunities?
Among the top seven players, who takes the most shots for Tennessee?
Player
Pct. of Shots
Bailey
16.2%
Fulkerson
13.8%
Vescovi
12.9%
Pons
12.6%
Johnson
12.0%
James
11.2%
Springer
10.7%
Victor Bailey had something straight out of his nightmares against Florida: 1-of-10 in the first half, 1-of-12 overall, 0-of-6 from three, 2-of-6 at the line, and five turnovers. Gross.
Bailey’s turnovers and missed free throws were unusual, he’s been good in both departments this season. Do the Vols want him taking more shots than anyone else?
This happens in part because he’ll score from inside and outside the arc, and can be used in different ways more than John Fulkerson. And it may be happening because some of the perimeter alternatives are freshmen who may not have or feel the greenest of lights; Keon Johnson tried to assert himself early in the second half and it worked well in that initial spurt.
But in particular from three, Bailey’s volume shooting hasn’t helped the Vols: he’s currently the fourth-best three-point shooter on the team (behind Springer’s small sample size, Vescovi, and James), but he takes the second-most threes, trailing only Vescovi. Vescovi is 26-of-66 (39.4%) on the year. Bailey is 17-of-55 (30.4%).
Tennessee needs Springer to play, obviously. And so far, they really only want Vescovi to shoot threes and distribute, even off penetration: he’s 10-of-24 inside the arc. If you’re looking for better scoring inside the arc, that’s the same old answer: John Fulkerson.
Fulkerson is the team’s best scorer from two at 54.7%. He doesn’t turn it over very often when he gets it. And he gets to the free throw line (84th nationally) and knocks them down once there (77.8%). As Rick Barnes loves to point out, the Vols need more from Fulkerson. He steadied their ship when the waters got bumpy last year, and turned in an elite performance at Rupp Arena. It’s a different kind of bumpy early this season, with so many parts producing an offense that needs to get better. But a huge piece of that puzzle on this team will always be John Fulkerson from two.
Get Springer healthy. Have a more even distribution of who’s taking your threes. Get Fulkerson going from two. And maybe those averages will start feeling a little more friendly.
Here’s the GRT Four Factors Forecast for Tennessee’s game against the Missouri Tigers tomorrow night.
Summary and Score Prediction
The good news: When these two teams last met, Tennessee dominated. They won primarily on the strength of turnovers, excellent shooting, and terrific defense. While the shooting tends to ebb and flow, turnovers and defense appear to be pretty consistent and reliable characteristics of this team, the last game against the Gators notwithstanding.
The bad news: On paper, Tennessee and Missouri are almost strikingly similar, and they are exceptional at getting to the free throw line and on defense, the last game against the Vols notwithstanding. And Tennessee went Jekyll and Hyde earlier this week and somehow turned all of their pretties into big, fat uglies against the Gators. The last time out, Tennessee played well and Missouri played poorly. If both teams are on, this contest should be much, much closer. And the Vols are plenty capable of turning in a clunker.
The line isn’t out yet, but KenPom likes the Vols by 6 and puts the score at Tennessee 68, Missouri 62, which translates into a 71% chance of winning.
Our new Hoops Statsy Preview Machine likes the Vols by 7 (Tennessee 67, Missouri 60).
Details below.
Baseline
Here’s what each team looks like at this point of the season.
That looks remarkably even. Tennessee does appear to protect the ball better than Missouri, although that certainly wasn’t the case against Florida earlier this week.
Here’s how things played out the last time these two teams met:
The Vols dominated that game. Rebounding and getting to the free throw line were even, but Tennessee won on turnovers and shooting percentages on both ends of the floor.
Four Factors: Straight-Up
Effective FG%
Conclusion: Among prior Tennessee opponents, Missouri’s effective shooting percentage is most like that of Colorado and Arkansas.
Turnover %
Conclusion: Most like Saint Joseph’s, Cincinnati, and USC Upstate. But Florida is the next-best.
Offensive Rebound %
Conclusion: Most like Vandy and Cincinnati on the offensive boards.
Free Throw Rate
Conclusion: These guys know how to get to the line. Only Texas A&M (among prior Vols’ opponents) is better.
Four Factors: Opponent impact
Effective FG%
Conclusions
Yikes. A little defense for you, and a little defense for me. Both teams really make it difficult on opposing offenses. Looking at those numbers, it should be the case that Tennessee’s offense struggles more than Missouri’s, but that’s not how it turned out the last time they played.
Turnover %
Conclusions
Turnovers were a big factor in the last matchup, and they could be again, as the Vols both protect the ball well and force opponents into a lot of turnovers, while Missouri appears to be generally bad at doing anything about it.
Offensive Rebounding %
Conclusions
On the boards, Tennessee should be able to create an advantage for itself by eating up more offensive rebounds than usual. Under the other basket, things look pretty even.
Free Throw Rate
Conclusions
Tennessee is getting to the free throw line surprisingly (to me, anyway) well, and Missouri does like to foul. And although the Tigers generally make a ton of trips to the stripe, they’re going up against a Tennessee team that does a pretty good job not fouling. Missouri did get six more trips than Tennessee the last time out.
I don’t know who Tennessee is going to hire. We’ve had enough experience at this to know there are no guarantees, which makes it less sensible to passionately push for one candidate over another. And hey, the powers that be at Tennessee – which now includes new athletic director Danny White – may have already made some moves, and eliminated half of this list or vetted guys who aren’t even on it. Either way, I’m hopeful this exercise can be of use to us in being better at evaluating what makes a good coach and, in particular, how we define success at Tennessee.
I continue to be drawn to this chart, which we used in a piece I wrote a couple days before the Texas A&M game, when the conversation on Jeremy Pruitt was only about wins and losses and not recruiting violations:
Thoughts about hiring coaches:
– Never hire a coach who didn't improve their prev. program (top left is empty) – Improving a program may not be repeatable (bottom right is as crowded as top right)
[Improvement] = [Avg. SP+ under coach] – [Program's 3-Year SP+ Avg. Before Coach] pic.twitter.com/bv6QhIhUGO
As we said a month ago: For every coach who turned mid-to-low-major success into major success – Matt Campbell, James Franklin, Dan Mullen – there are coaches who aced level one but struggled with level two: Scott Frost, Justin Fuente, Charlie Strong. You never know.
The chart also helps understand the value of Bill Connelly’s SP+ in measuring the outcome of each play instead of each game. It’s one of our favorite metrics for that reason, and the way it can help you see the differences between similar records.
For instance, you’ll notice Jeff Brohm out in front in the top right quadrant for his work at Western Kentucky and Purdue, even though Purdue is 19-25 under his watch. That’s in part because Purdue was 9-39 in Darrell Hazell’s four years preceding him. But it’s also how those games were lost and won: Hazell’s teams lost 23 games by at least three possessions in his four years. Brohm’s teams have lost seven in his four years.
Here’s the transition from Hazell to Brohm at Purdue using the chart’s metric: average SP+ of the previous coach’s final three seasons and the average SP+ of the current coach:
Jeff Brohm, Purdue
Coach
Year
Record
SP+
Avg SP+
Hazell
2014
3-9
-6.2
2015
2-10
-7.4
2016
3-9
-11
-8.2
Brohm
2017
7-6
5.8
2018
6-7
6.5
2019
4-8
-0.7
2020
2-4
6.1
4.4 (+12.6)
I’m not advocating Tennessee hire Jeff Brohm; we’ve already been down that road once. Maybe fans at Purdue are now asking if he can get them from Point B to Point C. He’s just an example of how growing a program can look.
(You’ll also note in that chart that Hugh Freeze is all over the top right quadrant, for what he’s done from Arkansas State to Ole Miss and now Liberty. Freeze is clearly a great coach on Saturdays. Of course, 27 of those wins at Ole Miss were vacated, and everything suggests Freeze will not be a candidate at Tennessee while the Vols are under their own investigation. So we’ll simply acknowledge all of that here and move on.)
'This isn’t the place to try somebody out. This time, we’re going to find proven winners.'
In interview w/ @knoxnews, UT System President Randy Boyd and Chancellor Donde Plowman outline qualities they're seeking in next AD and football coach.
Randy Boyd’s comments suggest the Vols will not hire an assistant coach (so I’m unsure what this means for viewing Kevin Steele as the safety net), and want a proven winner. One thing to note here, as we’ve had experience with it: “proven winner” should mean more than, “won games after inheriting a good situation.” We played that game with Butch Jones, who you’ll notice in the top left quadrant after following Brian Kelly twice:
Butch Jones, Cincinnati
Coach
Year
Record
SP+
Avg SP+
Kelly
2007
10-3
17.5
2008
11-3
8.6
2009
12-0
18.2
14.8
Jones
2010
4-8
2.5
2011
10-3
12.8
2012
9-3
11.1
8.8 (-6.0)
It wasn’t just that Jones was weighed down by his 4-8 transition year. The best he accomplished at Cincinnati was significantly lower than the ceiling he inherited.
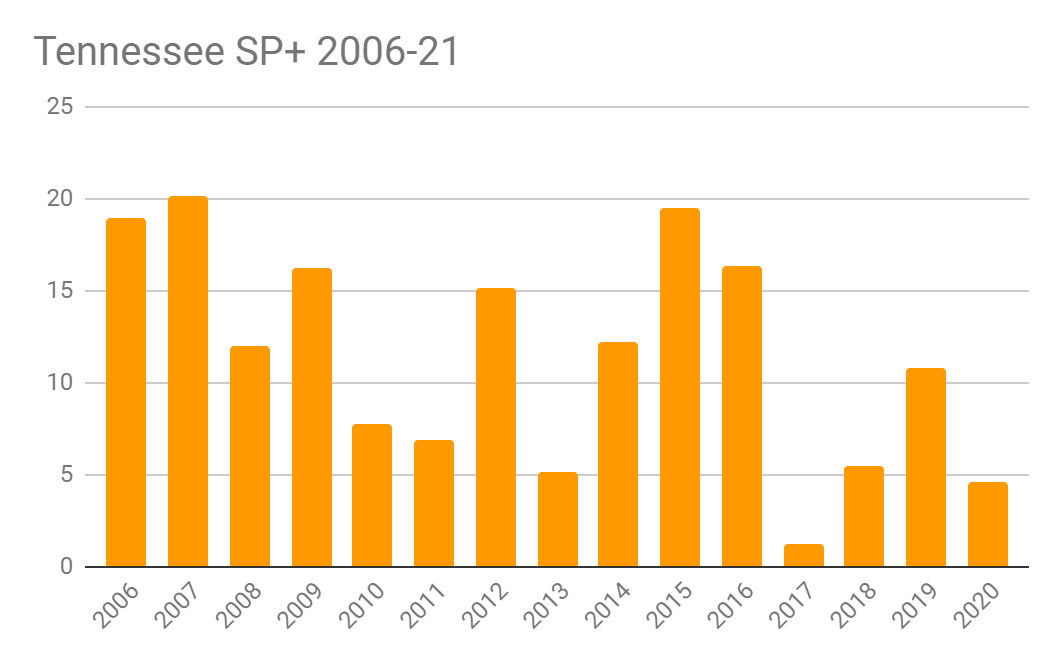
What will Tennessee’s new coach inherit? Here’s the Vols in SP+ since Phillip Fulmer’s last three years:
While Jeremy Pruitt’s final season wasn’t as bad as Butch Jones’ final season, Tennessee’s inability to even approach the peaks under Jones or late-stage Fulmer stand out. And, of course, the new guy seems likely to inherit some violations and a depleted roster through the transfer portal, though those losses could be somewhat offset by gains the same way.
In short, this has been going the wrong way for a long time. Who is best suited to get it moving forward?
If we’re looking for “proven winners”, here’s a good template to start with:
Gus Malzahn, Auburn
Coach
Year
Record
SP+
Avg SP+
Chizik
2010
14-0
26.5
2011
8-5
9
2012
3-9
4.8
13.4
Malzahn
2013
12-2
25.2
2014
8-5
24.2
2015
7-6
14.6
2016
8-5
15.3
2017
10-4
24.7
2018
8-5
23.6
2019
9-4
21
2020
6-4
11.4
20 (+6.6)
Malzahn, of course, gets some of that 2010 action as well; the 2020 team also has the Citrus Bowl loss to Northwestern on its resume that Malzahn wasn’t part of. One thing I like about SP+ here: you’ll note there’s not much that separates the 2013 almost-national-champions from the 8-5 finish the following year. The latter group wrecked #15 LSU by 34 and beat #4 Ole Miss, but lost to four Top 17 teams plus #25 Texas A&M by three. Malzahn’s teams did what I think you can realistically ask for, non-Bama division in this league: be in the hunt. The Tigers went to Atlanta ranked #2 in 2017, and spent time in the Top 10 in every one of Malzahn’s seasons.
Danny White’s hiring history doesn’t necessarily suggest a retread, but Malzahn’s history at Auburn would be in line with the kind of success we’d hope for from a good fit at Tennessee.
Let’s look at Danny White’s hires:
Lance Leipold, Buffalo
Coach
Year
Record
SP+
Avg SP+
Quinn
2012
4-8
-16.3
2013
8-5
-9
2014
5-6
-7.7
-11
Leipold
2015
5-7
-10.3
2016
2-10
-18.8
2017
6-6
-11.2
2018
10-4
-1.1
2019
8-5
-2
2020
6-1
5.3
-6.4 (+4.6)
Leipold came to Buffalo from Wisconsin-Whitewater, where he won the Division III championship six times in eight years. At Buffalo, the rebuild was the long game: his second team was one of the worst in college football, and his third was no better than his first. But since then, the Bulls have entered uncharted territory for their program: a pair of division titles, their first in ten years, and a Top 25 finish this season.
Scott Frost & Josh Heupel, UCF
Coach
Year
Record
SP+
Avg SP+
O’Leary
2013
12-1
12.3
2014
9-4
5.7
2015
0-12
-15.5
0.8
Frost
2016
6-7
-2.2
2017
13-0
14.1
6 (+5.2)
Heupel
2018
12-1
16.5
2019
10-3
19.1
2020
6-4
10.9
15.5 (+9.5)
The wild swing in 2015 throws some of the balance off here, to be sure. It’s also interesting to note that Heupel’s first team in 2018, which went undefeated before losing to LSU in the Fiesta Bowl, ranked higher than Frost’s final team in 2017, which went undefeated and beat Auburn in the Peach Bowl. And play-for-play, the best of the bunch was Heupel’s 2019 team, which lost at Pittsburgh by one, at Cincinnati by three, and at Tulsa by three. Along the way they busted up Lane Kiffin’s 11-3 FAU team 48-14, and beat Stanford 45-27. Should the Vols end up going with Heupel, we’ll make that point a lot. This year’s team beat Georgia Tech 49-21 in the opener, lost to Tulsa by eight and at Memphis by one, then lost to Cincinnati 36-33 and BYU in the bowl game.
So we know Danny White has experience with out-of-the-box hires; none of those three had previous FBS head coaching experience. We’ll see how that translates on the bigger stage in Knoxville.
On our podcast before White was hired, we started with these two names:
Coastal isn’t the best fit for this experiment: for one, they just joined the FBS level in 2017, then Chadwell took over for an interim season that same year, so there’s only Moglia’s 2018 campaign to compare it to. Nevertheless, Chadwell’s team improved not only this season, but in 2019 as well, even though the record didn’t show it. Chadwell might be the next big thing, it’s just a much smaller sample size.
Again, no guarantees once you get to level two, but these are all guys who’ve aced level one.
If the Vols go (or are forced to go) more of the obvious rebuild route:
Bill Clark, UAB
Coach
Year
Record
SP+
Avg SP+
Callaway
2011
3-9
-19.2
McGee
2012
3-9
-11.1
2013
2-10
-20.8
-17
Clark
2014
6-6
-4.2
2017
8-5
-15.5
2018
11-3
-0.3
2019
9-5
-1.4
2020
6-3
6.7
-2.9 (+14.1)
Clark, as you know, presided over the return of UAB’s program after it was shut down in 2015. His first team obviously carried some of that weight, but they were masterful in close games and earned bowl eligibility. It’s been all climb from there, including just a 24-20 loss to Louisiana, a double overtime loss to Louisiana Tech, and a 31-14 defeat to Miami this year. If the Vols hire Clark, perhaps it would help solidify the scope of this rebuild in all of our minds.
Let’s get this one on the board too:
Lane Kiffin
Coach
Year
Record
SP+
Avg SP+
Fulmer
2006
9-4
18.9
2007
10-4
20.2
2008
5-7
12
17
Kiffin
2009
7-6
16.2
16.2 (-0.8)
Coach
Year
Record
SP+
Avg SP+
Carroll
2007
11-2
32
2008
12-1
37
2009
9-4
16.6
28.5
Kiffin
2010
8-5
15.2
2011
9-4
24.7
2012
7-6
21.9
2013
10-4
22.5
21.1 (-7.4)
Coach
Year
Record
SP+
Avg SP+
Partridge
2014
3-9
-10.4
2015
3-9
-9.8
2016
3-9
-14.1
-11.4
Kiffin
2017
11-3
5.1
2018
5-7
-0.8
2019
11-3
7.5
3.9 (+15.3)
Coach
Year
Record
SP+
Avg SP+
Luke
2017
6-6
11.6
2018
5-7
9.8
2019
4-8
2.9
8.1
Kiffin
2020
5-5
8.3
8.3 (+0.2)
If Kiffin actually did return to the Vols, it would be his fifth head coaching stop, six counting the Raiders. His work at Florida Atlantic was impressive, no doubt, immediately improving the Owls and earning a second 11-3 record two years later. Pete Carroll was always going to be a tough act to follow, and that’s been true for Kiffin, Sarkisian, and Helton. The job at Ole Miss (and Tennessee) is too small a sample size to know yet: in both cases, definitely better than the previous year he inherited, but not enough data to consider it an improvement on the program overall. You’d love to have seen what he did at UT or Ole Miss in year two before entrusting your program to him.
I think Kiffin would be a good hire, but it would be foolish to consider him the only good hire, or an outright better choice than many of the names above.
Sometimes you can fall a little harder than you should for a coach just because they have power five experience. Consider:
Tom Herman, Texas
Coach
Year
Record
SP+
Avg SP+
Strong
2014
6-7
9
2015
5-7
3.7
2016
5-7
10.6
7.8
Herman
2017
7-6
10.6
2018
10-4
11.3
2019
8-5
12
2020
7-3
13.5
11.9 (+4.1)
Herman certainly had a big year in 2018. But overall, each of his teams weren’t significantly better than Charlie Strong’s first and last Texas squads. They did make small steps of progress in SP+ each year, but Herman also fell into the Butch Jones close game trap, and the best way to win close games remains not to play them. A +4 change in SP+ is similar to what Lance Leipold has at Buffalo, but the difference is how much his program has grown from year one until now. Herman’s, also similar to Jones at UT, never moved as fast as the powers that be at Texas probably felt it should have.
Finally, if the Vols go as big at head coach as they went at athletic director, here are the two names we thought would never consider this job:
Matt Campbell, Iowa State
Coach
Year
Record
SP+
Avg SP+
Rhoads
2013
3-9
-3.8
2014
2-10
-7.9
2015
3-9
-0.3
-4
Campbell
2016
3-9
0.7
2017
8-5
7.5
2018
8-5
7.9
2019
7-6
12.6
2020
9-3
18.7
9.5 (+13.5)
This is Point A to Point B to Point C. The record may have suggested treading water from year three to year four, but in 2019 Iowa State lost to #19 Iowa by one, at Baylor by two, Oklahoma State by seven, and at Oklahoma by one. This year they lost to Billy Napier’s Rajun Cajuns in the opener, 31-14…then beat Oklahoma, Texas, TCU, Baylor, lost to #6 Oklahoma State by three, and blew out the rest of the conference. They almost won the Big 12 title game, then beat Oregon by 17 in the Fiesta Bowl. Tennessee has never been as bad as where Iowa State was at the end of Paul Rhoads’ tenure, but they also haven’t been as good as Iowa State was this year since 2015, and before then not since Fulmer.
Luke Fickell, Cincinnati
Coach
Year
Record
SP+
Avg SP+
Tuberville
2014
9-4
6.9
2015
7-6
5.3
2016
4-8
-3.6
2.9
Fickell
2017
4-8
-6.4
2018
11-2
5.4
2019
11-3
9.1
2020
9-1
19.9
7 (+4.1)
Fickell’s first year did not go well. Since then, Cincinnati has been a rocket ship. This year they beat Army by two touchdowns, won 42-13 at #16 SMU, beat Memphis 49-10, and almost got Georgia in the Peach Bowl. The overall growth isn’t as strong because of where the program still was two years before he arrived, and the way he struggled in year one. But if you group 2015-17 together and compare it to 2018-20, Fickell’s average SP+ jump is 13.1, on par with the best of the other major progress you can find on our list:
Coach
Avg SP+ Jump
Napier
14.7
Clark
14.1
Campbell
13.5
Chadwell
12
Heupel
9.5
Kiffin avg.
7.3
Malzahn
6.6
Leipold
4.6
Fickell
4.1
Herman
4.1
Again, those few caveats:
Chadwell’s numbers are based on the smallest, weirdest data, with Coastal just joining FBS four years ago, and him serving as an interim that first year.
Kiffin’s numbers are the average of his four jobs; his individual numbers range from 15.3 at Florida Atlantic to -7.4 at USC, with small, incomplete improvements in one year at UT and Ole Miss.
Leipold’s progress is slowest and steadiest, and continued to gain momentum into year six.
Fickell’s numbers are weighed down by a terrible first year and Tuberville still being good two years before he left.
I have no idea who Tennessee will hire. But I do think it’s more than fair to say anyone from this list would be an upgrade, and many of them – at least in SP+ – the most “proven” winner Tennessee hired in a long time.
Joel and Will wade through the wreckage of Monday’s press conference announcing several for-cause terminations, including that of Jeremy Pruitt, and Phillip Fulmer’s retirement.
The common denominator in conversations I’ve had with friends and family today: will we have the patience for what comes next?
Is there any other way to be?
I guess that’s always been the allure of Gruden, Freeze, Pearl’s return, and other Tennessee fairy tales: the corresponding myth of the quick fix. They’ll solve it right away!
But there is no right away here, in part because we’re not sure how deep the hole will go or which athletic director is going shopping for ladders.
Back when we were only discussing firing Jeremy Pruitt for on-field results, one of the most compelling arguments for change was the idea that the realistic candidate pool might actually work in Tennessee’s favor this time. Even when you take Hugh Freeze off the table, that list of names is still only short Steve Sarkisian at this point. The Vols didn’t miss out on any of those guys because they waited too long.
The question now becomes, how many of those guys would still say yes to this job?
In looking at all the hot boards this afternoon, it’s funny how, at least for me, my first impression is still stubbornly attached to who Tennessee was more than a dozen years ago: “This looks like our basketball hot boards!” Coastal Carolina. Louisiana. Charlotte. UAB. Buffalo. Those old false narratives – we’re Tennessee, we should aim higher and pay more – hold on with surprising strength considering their age. In reality, Tennessee’s last four hires came as fired NFL coach, Louisiana Tech, Cincinnati, and assistant at Alabama. The guy before that, another chapter coming to its end today, was an assistant at Tennessee.
For instance, if Tennessee hired Billy Napier – 28-11 overall with the Rajun Cajuns and 21-4 the last two years – he’d be the most proven candidate as a collegiate head coach the Vols hired since Johnny Majors. Butch Jones was 23-14 at Cincinnati, but only after following Brian Kelly, who went 34-6. Napier followed Mark Hudspeth, whose last three years at Louisiana went 4-8, 6-7, and 5-7.
But would Billy Napier say yes to this job right now? Would Gus Malzahn or Tom Herman?
How much of what we assume to be the list – current coaches from the Sun Belt, Conference USA, and the MAC, but all of them actually more proven winners and program builders on their own merits as head coaches than anyone we’ve hired recently – would say yes to being the head coach at Tennessee in 2021?
I love a good historical comparison, but I’m not sure there is one for where Tennessee is right now.
We also know Tennessee is one of the seven teams in the “top half” of the SEC that seem capable of recruiting at a championship level, but the Vols are seventh of those seven already, trying to beat Florida/Georgia/Bama at a lesser version of their own game. The window was open for Butch Jones but his Vols couldn’t get through, and even though Jeremy Pruitt appears to have closed the gap from purely a talent standpoint, the window of opportunity is much smaller now thanks to the success of Kirby Smart and Dan Mullen in the division.
So yeah, it’s hard to win here right now. Maybe it’s harder now than ever. And it’s about to get harder.
What do we do with all that?
For now: patience. It’s the best available choice. Maybe the only one.
You’re a grown up, of course. You can do what you want. We’re ten months into a pandemic, we know good and well people don’t have to be anything, especially patient. Patience is hard.
But failing to learn it well usually ends up worse.
When the Vols lost to Arkansas, I wrote about transitioning our metaphor from wilderness to exile, assuming the Vols wouldn’t fire Jeremy Pruitt no matter what happened the rest of this season because of the pandemic. Turns out, there are things that will make them fire him, and those things make exile much more likely, which means I believe even more in what we said then: we’re going to be here for a season. The biblical sense, not the Fall 2021 sense. This is where we live right now. And a stiff neck will not get you out any faster.
In exile, you live your life. With purpose. Build houses and live in them. Increase, do not decrease. Seek the welfare of the city.
And do not listen to the prophets who tell you this will all be over soon. Do not listen when anyone tells you so-and-so is a sure thing; we should all know better by now that’s a lie. Be careful when giving your time and energies to those whose business interests are in keeping you agitated.
How do we live in exile? Purpose. Patience.
Seek the welfare of the city. Words matter. How we communicate matters. It all matters. And I think patience will matter most in the midst of this season. Patience, paradoxically, is the healthiest way out of exile.
Here’s the GRT Four Factors Forecast for Tennessee’s game against the Florida Gators tomorrow night.
Summary and Score Prediction
The good news: The Gators are somewhat turnover-prone, and the Vols’ defense is likely to inflame that a bit. Tennessee also appears to have a distinct advantage on the boards at both ends of the floor, and Florida’s propensity to foul will likely put Tennessee at the free throw line more often than usual. Plus, any advantage the Gators may have should be mitigated by the Vols’ terrific defense.
The bad news: The Gators shoot well, and if they are hot, they can make it a game.
The line isn’t out yet, but KenPom likes the Vols by 3 and puts the score at Tennessee 70, Florida 67, which translates into a 61% chance of winning.
Our new Hoops Statsy Preview Machine likes the Vols by 13 (Tennessee 75, Florida 62). For the last game against Vanderbilt, the Machine predicted a 21-point Vols win and a score of 78-57. Tennessee won by 20, 81-61.
Details below.
Baseline
Here’s what each team looks like at this point of the season.
Knee-jerk analysis: Pretty even on offense, but, as you’d expect, the Vols’ defense is much better. The Gators are also more likely to turn the ball over. Rebounding and free throws look basically even if you look at the teams in a vacuum. But see below for the opponent impact.
Four Factors: Straight-Up
Effective FG%
Conclusion: Florida shoots about like Tennessee, and about like Colorado among prior Vols’ opponents.
Turnover %
Conclusion: Most like Vanderbilt and App State in the turnovers department.
Offensive Rebound %
Conclusion: Most like Vandy and Missouri on the offensive boards.
Free Throw Rate
Conclusion: Hmm. Between Missouri and Alabama in getting to the free throw line, but not especially like either one of them.
Four Factors: Opponent impact
Effective FG%
Conclusions
The usual story here. Tennessee needs to improve its shooting, and Florida will present some resistance in that regard, but on the other end, the Vols are going to really make it difficult for the Gators to do as well as they usually do. Bottom line, Tennessee better than usual, but Florida worse.
Turnover %
Conclusions
Tennessee is still really excelling at turnovers, both in protecting its own and stealing its opponents’. The Gators aren’t bad at creating turnovers, but they’re teetering on bad at giving them up.
Offensive Rebounding %
Conclusions
That looks like a major advantage on the o-boards for the Vols and a less-pronounced advantage at the other end.
Free Throw Rate
Conclusions
Another huge advantage here for the good guys, as the Gators are likely to usher the Vols to the free throw line quite a bit. On the other end, Florida doesn’t get there especially often, and Tennessee isn’t likely to help.
The Vols, we think, are back in action tomorrow against Vanderbilt. Tennessee lost a date with South Carolina on Tuesday, then lost the reshuffled trip to Nashville, but we’re hopeful we’ll see the Vols and ‘Dores in Knoxville tomorrow (6:00 PM, SEC Network). The SEC left the final Saturday of the regular season open on March 6, so there’s a chance to make up one game. We’ll see what happens.
In Tennessee’s first ten games, the Vols have faced three Tier A opponents (via KenPom) and two Tier B opponents. On the other side of the Vanderbilt game comes the season’s most important stretch: five straight weeks, ten straight games against Tier A or B competition. Tennessee’s final three games, as it stands today, are against lesser competition: the original date for the trip to Vanderbilt, a trip to Auburn, and Georgia in Knoxville. Throw in a potential make-up with South Carolina, and the Vols would finish with four straight games against teams outside the NCAA Tournament conversation (…we think. South Carolina has only played five games total, so they’ll have a ton of questions to answer upon their return to action).
But the stretch from January 19 through February 20 is where Tennessee’s fate will be decided: at Florida, Missouri, Mississippi State, Kansas, at Ole Miss, at Kentucky, Florida, at LSU, South Carolina, Kentucky.
There are two goals coming into that stretch, and the one should have a good chance to lead to the other: win the SEC outright, and earn the program’s first number one seed.
The SEC
Three years ago, when the Vols last won the league, Tennessee opened SEC play in a big game at Arkansas. The Vols lost in overtime in a contest that featured heavy referee influence, shall we say. Emotions were high, etc. Then Tennessee returned home and gave up 341234 offensive rebounds in a loss to Auburn.
The Vols, of course, figured it out: they beat Kentucky in Knoxville four days later, went 13-5, and shared the league title with…Auburn. As it turned out, Tennessee played the second-best team in the league in game two, we just didn’t know it at the time.
I point that out to say this year, the Vols opened SEC play on the road against Top 15 Missouri, and delivered an emotional result of a different kind: the 20-point win that made those two goals up there the right ones for this team. Then they returned home and lost a weird lineup game to Alabama, who hit 10-of-20 from the arc and 8-of-11 in the second half.
Turns out, Bama’s good.
The Tide followed up with a 15-point win over Florida in Tuscaloosa, and just beat Kentucky in Rupp – still worth something – by 20, which is plenty of something. Alabama is 5-0 in the SEC and now 21st nationally in KenPom. I think Tennessee played the second best team in the SEC in game two, we just didn’t know it at the time…and like 2018, we won’t get another shot at them.
KenPom projects the Vols and Tide to “split” the SEC title: Alabama at 14-4, Tennessee at 13-4, and maybe they’ll get the South Carolina game rescheduled. LSU is one game back in those projections; the Tigers and Tide do play each other twice, so some of that may sort itself out. But Alabama has the pieces and the 5-0 head start to make a serious run at the league title. And they too will make a lot of their living right now: Arkansas, at LSU, Mississippi State, Kentucky, at Oklahoma, LSU, at Missouri in their next seven games. The logic here suggests you want to be ahead of Alabama in the standings when they finish that stretch on February 6, as a trip to Fayetteville on February 24 is Alabama’s only game against a Top 60 KenPom foe in their final seven contests.
KenPom projects the Vols to go 7-3 in that ten game stretch after Vanderbilt, which would put them in range for a 13/14-and-4 finish. They’ll all count, and that goes for the chase for a one seed too.
The #1 Seed
Let’s write GONZAGA at the top of your bracket.
Baylor goes next, but the Bears are getting ready to run their own little gauntlet: at Texas Tech, Kansas, at Oklahoma State in their next three. If they run that table, put them in all caps next.
From there, the chase for the two remaining one seeds gets murkier. As was the case two years ago, a lot will depend on how the selection committee views the power of each conference: in 2019, three ACC teams were placed on the top line, while Tennessee – fresh off a huge win over Kentucky and a huge loss to Auburn in the previous 48 hours – fell to the two line. Unlike previous years where regional sites mattered, this year we should get something that far more resembles a true s-curve (with a few exceptions to keep top teams from the same conference in separate regions). So, for instance, if the goal is to avoid Gonzaga for as long as possible, you don’t want to be the last two seed or the first three seed, because that should be Gonzaga’s region.
But the surest way to stay away from the Zags until the Final Four – a place Tennessee has never been – is to earn one of the other one seeds.
In non-pandemic times, number one seeds have averaged 4.5 losses on Selection Sunday over the last four tournaments. That, of course, includes conference tournament play; Tennessee hasn’t won the SEC Tournament since 1979. So all of these projections from KenPom would be pre-conference tournament.
KenPom Projected Records
Gonzaga 23-1
Baylor 21-3
Michigan 20-4
Villanova 18-4
Tennessee 19-5
Iowa 20-6
Texas 19-6
Creighton 19-6
I’d also throw in Houston, projected to finish 20-3 in the American, as an option for a top two seed. From here, it depends on who else can separate in the two best conferences (Big 10/12), and how the committee views leagues like the SEC and Big East by comparison. Illinois is just .05 points behind Tennessee in KenPom overall, but projected to finish 16-9. Similar stories with Wisconsin, Texas Tech, Kansas, and West Virginia.
If Alabama keeps winning, more power to them: that helps the league’s image in a year when Kentucky isn’t a factor. But no matter what Alabama does, the Vols have to keep holding up their end of the bargain.
For what it’s worth, Bart Torvik’s predictive bracketology has the Vols grabbing the final number one seed (with Texas the two in that region, spicy). It puts LSU on the four line, Alabama at five, Missouri at six, Arkansas at eight, and Florida at ten. In the January 11 Bracket Matrix, Tennessee is the third two seed, which would put them in Baylor’s region if the curve held. There Missouri is a four, Alabama at seven, with Florida, LSU, and Arkansas all at nine.
The Vols technically won’t control their own destiny for the SEC title until Alabama loses a game, but if the Tide run the table, uh, they’ll deserve it. But Tennessee still feels very much in control of its own destiny to capture a one seed, especially as Big 10/12 teams begin to pick each other off. It’s still the right goal for this team, and one that would give them the best chance to check some other program firsts off the list.
Here’s the GRT Four Factors Forecast for Tennessee’s game against the Vanderbilt Commodores tonight.
Summary and Score Prediction
The good news: The Vols should have decided advantages in almost every facet of the game this evening, especially on defense, in turnovers, and at the free throw line.
The bad news: Tennessee and Vandy are about equally as good at rebounding the ball.
Vegas has the Vols as 12.5-point favorites. With an over/under of 137.5, that puts the score at something like Tennessee 75, Vanderbilt 63.
KenPom likes the Vols by 12 and puts the score at Tennessee 73, Vanderbilt 61, which translates into an 87% chance of winning.
Our new Hoops Statsy Preview Machine likes the Vols to cover easily, by 21 (Tennessee 78, Vanderbilt 57).
Details below.
Baseline
Here’s what each team looks like at this point of the season.
Knee-jerk analysis: This looks even on the boards, but the Vols appear to have a decided advantage everywhere else. Tennessee is currently No. 10 in the AP Top 25, while Texas A&M is unranked. In KenPom, the Vols are No. 9, and the ‘Dores are No. 137.
Four Factors: Straight-Up
Effective FG%
Conclusion: Vanderbilt shoots about like the Vols. Colorado is the most similar prior opponent in this regard.
Turnover %
Conclusion: Most like Alabama and Missouri when it comes to turnovers.
Offensive Rebound %
Conclusion: Basically like Colorado on the offensive boards. Also similar to Texas A&M.
Free Throw Rate
Conclusion: Who doesn’t like free stuff? Vanderbilt.
Four Factors: Opponent impact
Effective FG%
Conclusions
The Vols shouldn’t have much trouble hitting their shots tonight. Vanderbilt? Well, they’re probably going to have some trouble.
Turnover %
Conclusions
Ooh, look! Free turnovers! And they’re mine, all mine! I love turnovers!
Offensive Rebounding %
Conclusions
Yes, even with the defensive interference, we’re looking at an even game on the boards on both sides of the floor tonight.
Free Throw Rate
Conclusions
Tennessee’s still not really getting to the free throw line all that often, but Vandy may make it a bit easier this evening. And on the other side of the floor, the Commodores are too proud to accept your stinking charity anyway.
Alabama opened as a 7-point favorite over Ohio State, and on the morning of the game, the line is now 8.5. What does the GRT Statsy Preview Machine have to say about that?
Scoring Offense and Scoring Defense for both teams
Alabama’s Scoring Offense this year: 48.2 Ohio State’s Scoring Offense this year: 43.4 Alabama’s Scoring Defense this year: 19 Ohio State’s Scoring Defense this year: 22
From the perspective of Alabama
The Ohio State scoring defense of 22 is most similar to the following prior Alabama opponents:
Texas A&M 21.7
Georgia 20
And Alabama’s offense cares not one bit: The Tide scored 52 points against Texas A&M and 41 points against Georgia, an astounding 223% of what those teams did against it entire slate of competition this season. That makes the estimated points for Alabama against Ohio State 49.1. Sheesh.
But . . . the Ohio State scoring offense of 43.4 is most similar to the following prior Alabama opponents:
Florida 39.8
Mississippi 39.2
Florida got 46 against Alabama, and Mississippi got 48, so the defense can be vulnerable. Combined, that’s 119% of normal, and it puts the estimated points for Ohio State against Alabama at 51.7. Well.
Estimated score: Alabama 49.1, Ohio State 51.7
From the perspective of Ohio State
The Alabama scoring defense of 19 is most similar to the following prior Ohio State opponents:
Clemson 20.2
Indiana 20.3
Ohio State scored 49 points against Clemson and 42 against Indiana, which is an equally-astounding 225% of normal for those teams. It puts the estimated points for Ohio State against Alabama at 42.8.
The Alabama scoring offense of 48.2 is most similar to the following prior Ohio State opponents:
Clemson 43.5
Penn State 29.8
Ohio State allowed only 28 points to Clemson and 25 to Penn State, 72% of what those teams usually did this season. That Penn State comp is actually the second-best comp, but it’s really not even close. But because it’s the (second-)best we have, we’ll use it. Estimated points for Alabama against Ohio State: 34.7.
Estimated score: Ohio State 42.8, Alabama 34.7
SPM Final Estimates
Combining the results from both perspectives, here’s what we get:
SPM Final estimated score: Alabama 41.9, Ohio State 47.3
SPM Final estimated spread: Ohio State -5.4
Difference between the SPM and the Vegas opening spread: 12.4
It’s odd for this to happen, but according to the Machine, this is a Category 3 game, meaning it feels good about that prediction. But read on.
Eyeball adjustments
Yikes, that just feels wrong, doesn’t it? I don’t think I’ll use the word “shocked,” but I was really, really surprised by that. So I ran the thing again, this time with all games as comps, rather than just the two “best” comps. In fact, I didn’t stop there; I ran the thing for 3, 4, 5, 6, 7, 8, 9, 10, 11, and 12 comps. The Machine picked Alabama in every single one of those scenarios, most by right around the Vegas opening line of 7 points. I will note, for whatever it’s worth, that it also never got above the current line of 8.5.
So the question is, is there something wrong with those two “best” comps, or is it actually on to something?
The primary difference between those two comps and all of the others is that the Alabama defense got torched, giving up 48 points to Ole Miss early in the season but also giving up 46 points to Florida late. Nobody else got over 24 points the entire season. They held Notre Dame to only 14 in the most recent game. The Irish offense averages 33 points per game.
The question then is this: Is Ohio State’s offense like Florida’s (and Ole Miss’) or Notre Dame’s? Are they going to put up points at will, or are they going to find it much more difficult to put up points tonight? I don’t feel good about a prediction either way on that question. Maybe they just get their usual output?
Based on all of that, I’m going with Alabama 45, Ohio State 42.
Other predictions from other systems
As I said earlier, Vegas had Alabama as a 7-point favorite to open. With an over/under of 76, that’s a prediction of something like Alabama 42, Ohio State 35.
According to the SP+ rankings, Bill Connelly appears to like Alabama by 4.3.
Bottom line
The Statsy Preview Machine is waving the danger flag for Alabama by pointing to potent Ole Miss and Florida offenses actually being almost able to keep up with Alabama’s own potent offense. It likes Ohio State by 5 points. I have more confidence in Alabama’s defense than that, so I think the Tide win, but I will buy in to them not covering either the opening 7-point spread or the current 8.5-point spread.
Ten games in, we’d normally be 33% of the way through the regular season. But depending on whether Tennessee’s game with South Carolina gets rescheduled, we’re more like 40-42% of the way home this year. Either way, we’ve got enough data to draw a couple of meaningful conclusions about this team.
Their defense still sets them apart: 87.1 in KenPom’s defensive efficiency ratings is second nationally, and still the best for any Tennessee team ever. I still think the offense played better than it felt at Texas A&M, in part because they got a lot of action late in the shot clock: “This possession isn’t going anywhere, wait no here’s a bucket…”. On Sunday evening the Vols are 27th in KenPom’s offensive ratings, flirting with that dual Top 20 set every national champion has.
But the most striking thing about the offense continues to be how truly balanced it is.
Through these first ten games, Tennessee’s top seven scorers all average between 8-12 points per game. It makes the Vols harder to scout, harder to defend. Five of those seven have led the team in scoring already, but Santiago Vescovi’s 23 on Saturday are still the team’s season high.
And we really haven’t seen anything like that on a tournament team at Tennessee.
This year should/will make 10 NCAA Tournament teams from Tennessee in the last 16 years. The other nine had either four or five players each account for at least 10% of Tennessee’s total points (it jumps up to six players in 2006 and 2009 if you round up from 9.5%+).
But these Vols currently feature seven players accounting for at least 10% of Tennessee’s points:
Bailey
16.1%
Fulkerson
15.1%
Vescovi
13.4%
Springer
13.0%
Johnson
11.1%
James
10.8%
Pons
10.2%
Offensively, Tennessee’s best teams have leaned either to the one-two punch, or far more balance:
One-Two Punch
Year
1st Scorer
% of Pts
2nd Scorer
% of Pts
Top 2
2007
Lofton
26.1%
J. Smith
19.1%
45.2%
2011
Hopson
24.1%
Harris
21.7%
45.8%
2014
McRae
26.2%
Stokes
21.2%
47.4%
In each of these cases, Tennessee’s top two scorers nearly outdid the rest of the team by themselves. Doing it this way can make your ceiling heavily reliant on what the third guy can give you: see Josh Richardon’s late emergence in Tennessee’s 2014 run. The 2007 Vols were guard dominant, still playing Dane Bradshaw post minutes while Ramar Smith was the team’s third leading scorer. And in 2011, there really wasn’t much happening behind Hopson and Harris, and little fluid offense overall beyond those two getting their own shots: Cameron Tatum was the third-leading scorer at 12.5% of the team’s points, the lowest for any third scorer on these tournament teams.
You can find the more balanced groups simply by looking at how much each team’s leading scorer contributed:
Balance
Year
Leading Scorer
% of Total Points
2014
McRae
26.2%
2007
Lofton
26.1%
2011
Hopson
24.1%
2019
Williams
22.8%
2009
T. Smith
22.2%
2006
Lofton
21.2%
2018
Williams
20.5%
2010
Chism
19.2%
2008
Lofton
18.7%
2021
Bailey
16.1%
In 2008, Tyler Smith’s arrival (and Chris Lofton’s health) made Tennessee far more diverse offensively, with great results. Tyler Smith also skews the 2010 math somewhat after being dismissed in early January, but Chism, Hopson, Prince, and Maze all ended up scoring between 14-19% of that team’s points overall, a strong sense of balance amongst that group.
Tennessee’s best offensive team walked the line between both: two years ago, Grant Williams had 22.8% of Tennessee’s points, Admiral Schofield 20%. But it was Jordan Bone’s offensive maturity – going from 9.8% of Tennessee’s points in 2018 to 16.4% in 2019, the third-leading scorer – that made a huge difference, while Lamonte Turner and Jordan Bowden continued to do their thing.
At the 40% mark, we shouldn’t expect these Vols to have a breakout offensive superstar. But I’m not sure we fully know what to expect beyond that, simply because we’ve never seen a Tennessee team rely on so many guys to get it done. That means one of the biggest unanswered questions is, “Who gets it done in crunch time?” Without Jaden Springer against Alabama and with John Fulkerson off the floor, Tennessee struggled. The late-game answer against Cincinnati and Arkansas was getting to the free throw line, with John Fulkerson a key component.
KenPom projects the Vols to play four one-possession games left on their schedule (at Florida, Kansas, at Kentucky, at LSU). The ebb and flow of a season suggests we’re going to see more than that in these last 14-15 games. Keep an eye on the crunch-time lineups.
The lead story should continue to be Tennessee’s defense. But the extraordinary, “It’s not about me,” balance of Tennessee’s offense is, so far, equally unheard of around here.
You must be logged in to post a comment.