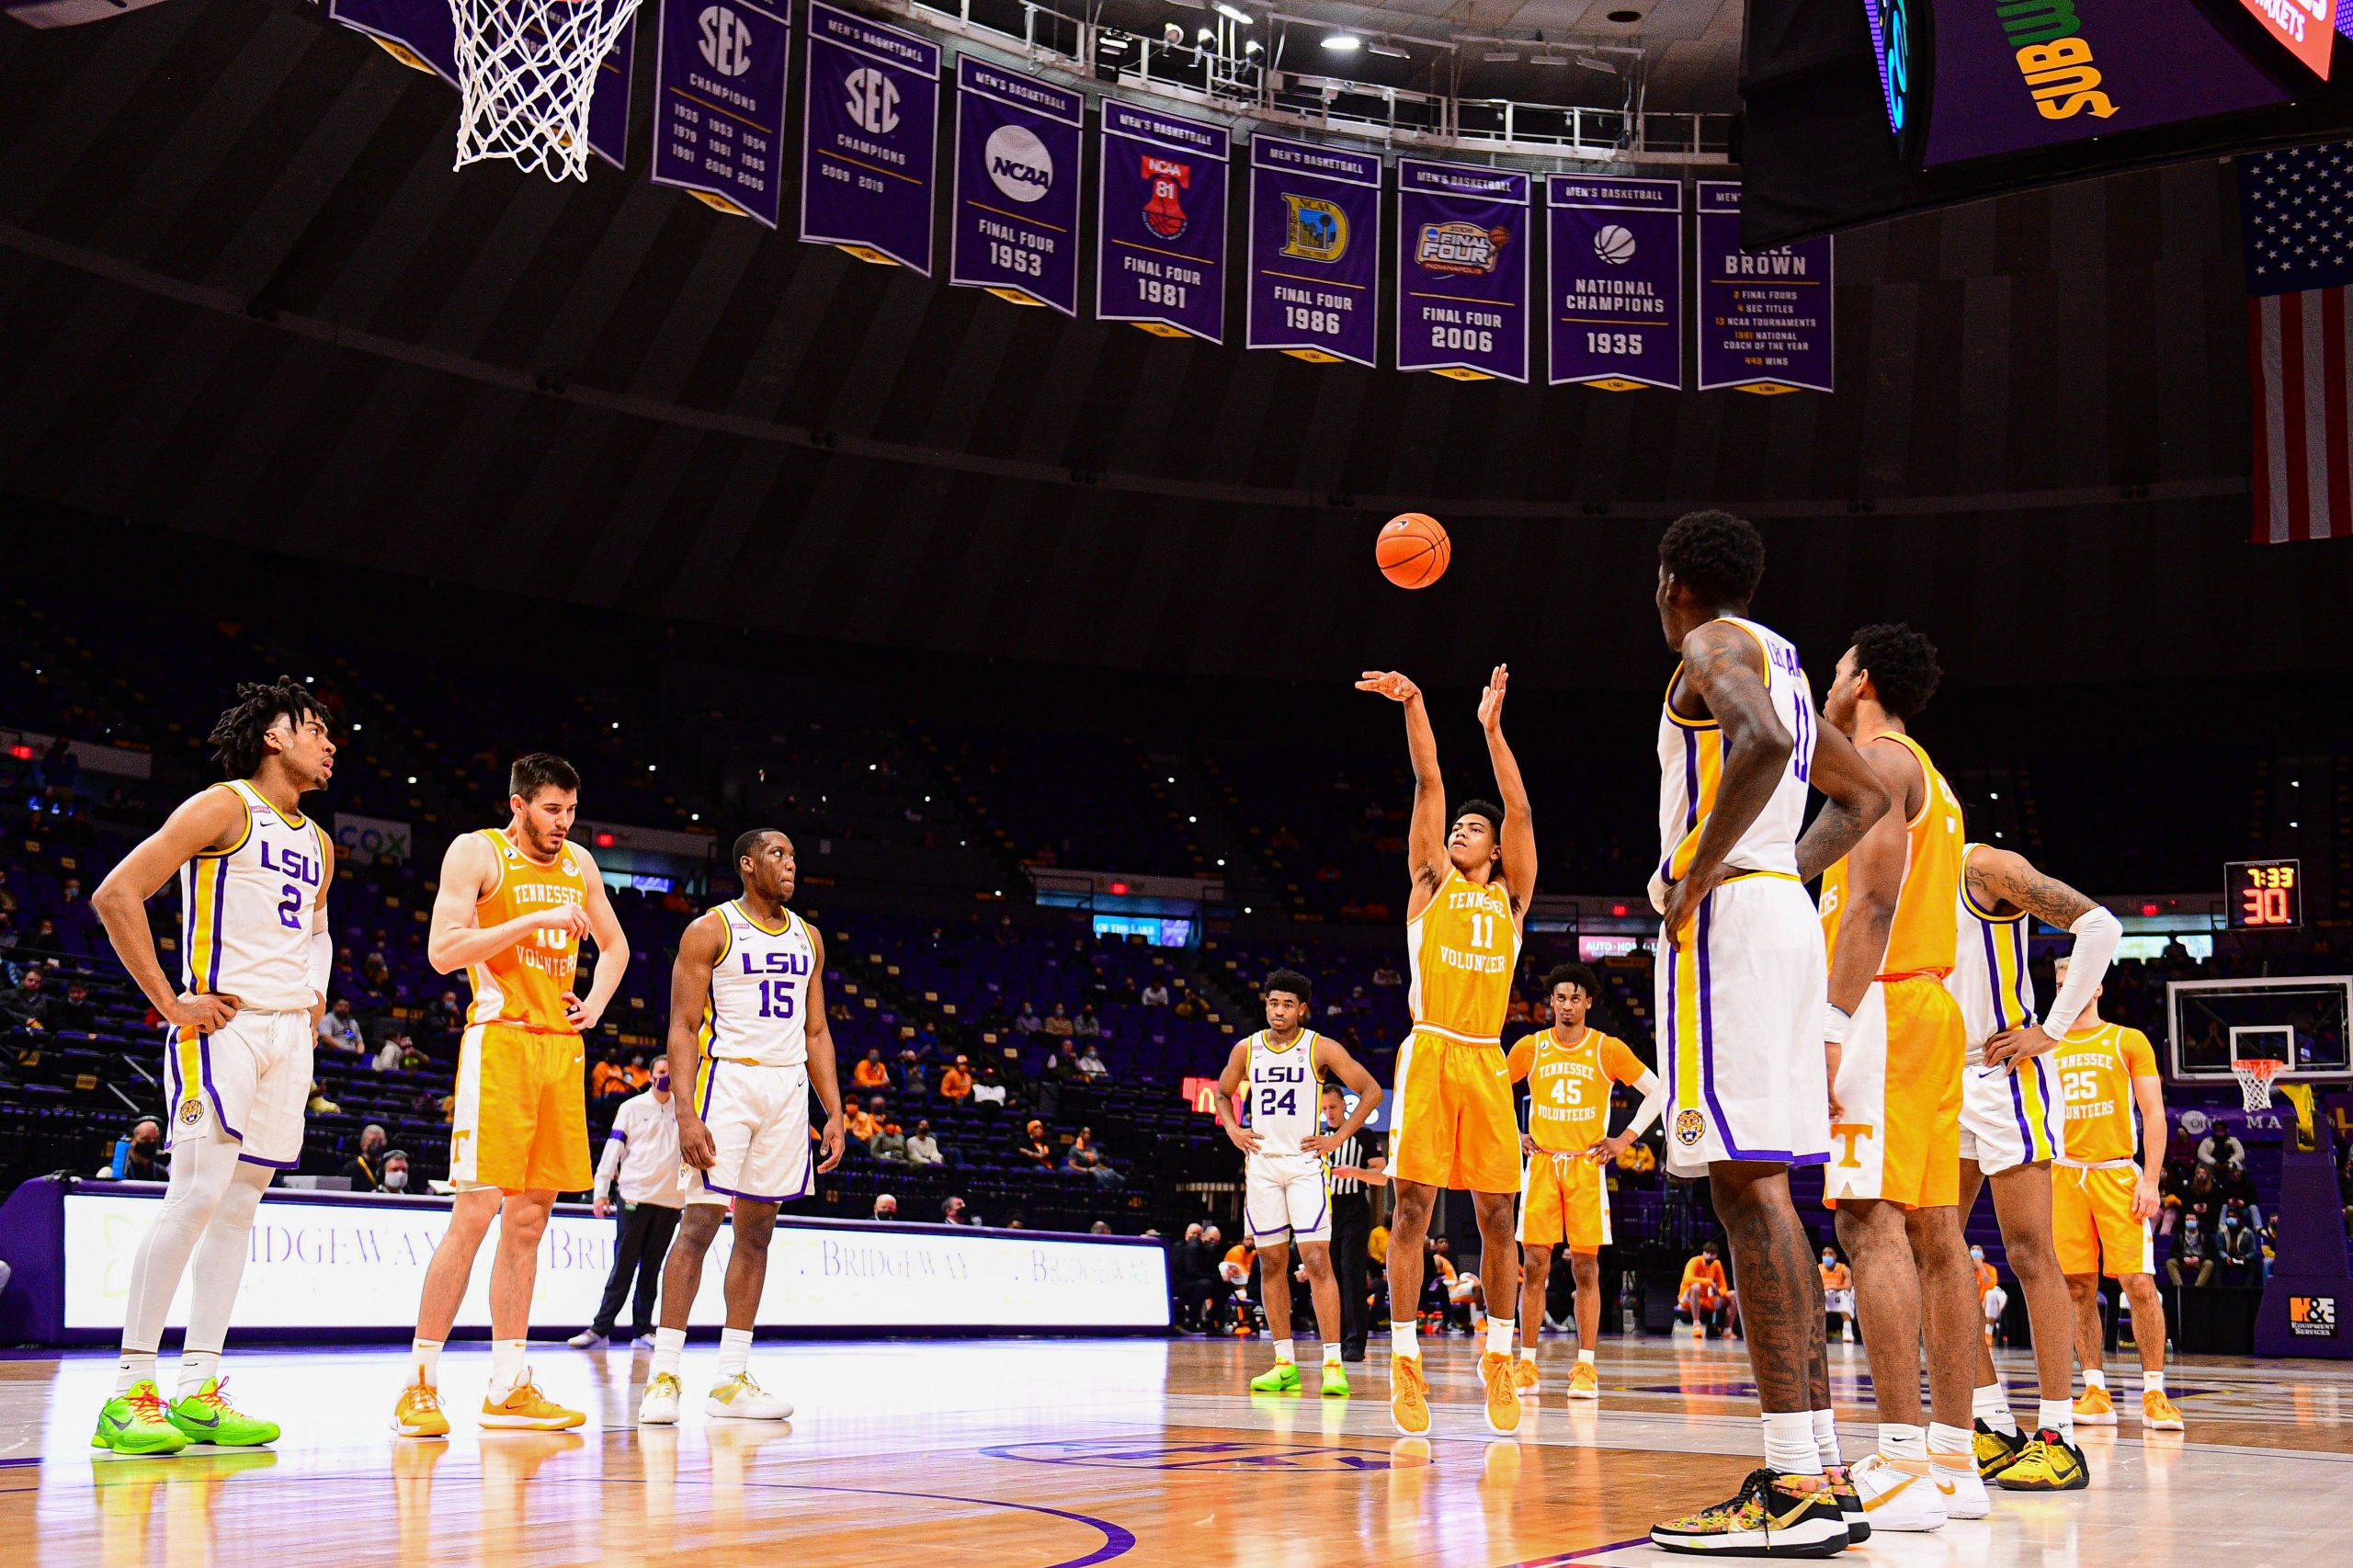
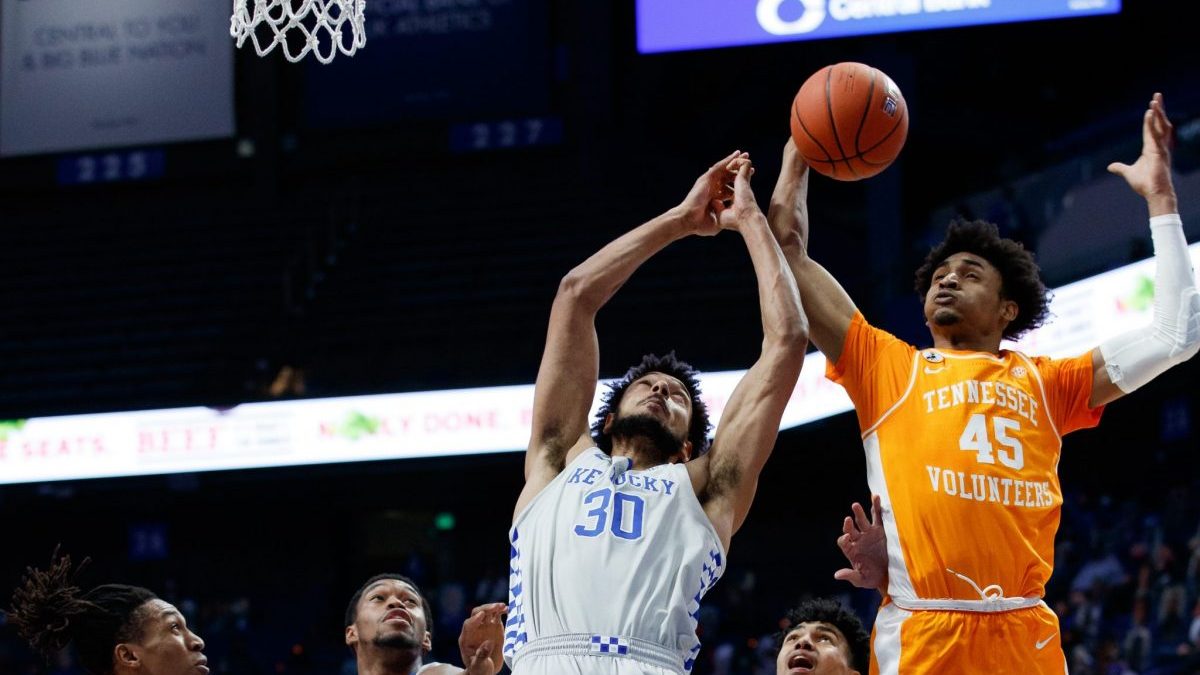
What are the NET rankings in men’s basketball?

In the 2018-19 men’s basketball season, the NCAA started leaning on something called NET rankings when comparing team resumes come tournament time. But what are NET rankings, and how do they work?

The N.E.T., or “NCAA Evaluation Tool” Ranking, is a system used by the NCAA to rank men’s college basketball teams, both during the season and when it comes time to select and seed tournament teams. In 2018, it replaced the RPI, which had been around since 1981 but had become increasingly disfavored over time.

According to the NCAA general description of the system, the NET evaluates a team based on “game results, strength of schedule, game location, scoring margin, net offensive and defensive efficiency, and the quality of wins and losses.”

Okay, fine. We’re going to look at stuff that matters when trying to figure out how good a team is. Good start.

A more detailed explanation identifies five main factors in the NET Ranking: Team Value Index, Net Efficiency, Winning Percentage, Adjusted Win Percentage, and Scoring Margin.

Team Value Index

The Team Value Index component of the NET is a results-oriented algorithm designed to reward teams for beating other good teams. The man remains mysterious behind the curtain, but the NCAA has said that this component includes factors such as who won (duh), the opponent (okay, good), and the location (um, okay.) I’d love to see more detail on what’s happening inside the machine here, but I doubt they’re going to make the process that transparent.

Net Efficiency

The second component is Net Efficiency, which is defined as Offensive Efficiency minus Defensive Efficiency.

Offensive Efficiency is calculated as total points divided by Total Number of Possessions. Total Number of Possessions equals field goal attempts minus offensive rebounds plus turnovers plus .475 of free throw attempts. I’m not sure whether to agree or disagree on the number-of-possessions calculation, but I’ll defer to the nerds here.

Defensive Efficiency is a similar calculation: Opponent’s total points divided by Opponent’s Total Number of Possessions. Opponent’s Total Number of Possessions is opponent’s field goal attempts minus opponent’s offensive rebounds plus opponent’s turnovers plus .475 of opponent’s free throw attempts. Whew, that’s a lot of math with words.

Winning Percentage

Winning Percentage is a simple calculation of wins divided by total games played. Thank you.

Adjusted Win Percentage

Adjusted Win Percentage appears to juice the Winning Percentage based on where wins and losses occurred. Winning on the road is the most valuable (+1.4), while losing at home is the most costly (-1.4).  Home wins and road losses count as +.6 and -.6 respectively, presumably based on the notion that you don’t deserve a reward for doing what you’re expected to do. Neutral-site games are logged at face value. 

Scoring Margin

Scoring Margin is, as you’d expect, simply the difference between a team’s score and its opponent’s score. However, the point differential is capped at 10 points, and all overtime games are capped at 1 point.

I like that scoring margin is considered, and I like a cap, but I’d like to see some more data to determine whether 10 points is the best threshold for that to kick in. A one-point cap for overtime makes sense.

Here’s how all of that looks in infographic form:

https://twitter.com/marchmadness/status/1067063960753573889

The NET is a tool

Pardon the heading; I just wanted to make sure you were still reading. The NET isn’t actually a TOOL, but it is merely a tool, meaning it’s not the final word in NCAA Tournament teams or anything. It’s just one component of the selection process. The at-large teams will still be chosen by the selection committee, and the committee will still use a combination of analytics and human subjectivity to select and seed those teams. They’ll still use the team sheets, and the team sheets will still rely heavily on the quadrant system utilized for the first time last year. The primary difference is that the game results are now sorted into the quadrants based on NET ranking instead of RPI.

Bracketology: How to roll your own

I wonder what percentage of pitiful people in the United States have never heard of “filling out a bracket” for the NCAA Tournament. In a country with a population of over 325 million, some 70 million brackets were completed last year, according to ESPN. That number probably includes multiple brackets by a single person, but whatever your level of expertise at nitpicking, that’s a lot of people filling out a lot of brackets. And there’s some significant number in addition to that of people who know about filling out a bracket but have never actually done it. Poor them.

The NCAA Tournament bracket is a big deal, is what I’m trying to say. It’s such a big deal that people start talking about it long, long before the official bracket — complete with the teams and their seedings — is announced on Selection Sunday. There are numerous sites that engage in what is now known as “bracketology,” the process of guessing beforehand what the official bracket is going to look like heading into the tournament. Currently, the bracketmatrix.com tracks 91 such sites, and there are probably more out there lurking beyond even the time and resources of the good folks behind the bracket matrix.

We fans are interested because it matters. We want to know the chances of our team going to the Big Dance, and fans of teams that are a lock to get in want to know their likely seeding. Because seeding in the NCAA Tournament matters. A lot.

But how do the bracketologists do it? What goes into anticipating what the bracket is going to look like on Selection Sunday? Is there a process involved or is it all just pure guesswork?

Well, it turns out that it’s part process and part educated guess. At the bottom of this post, there’s a step-by-step guide for cooking up your own bracketology, but first, a little explanation is in order.

The general process of bracketology

At its most basic, bracketology consists of first identifying the teams likely to participate and then seeding those teams among four pre-determined regions or venues.

Selecting the participants is done by allowing some teams to earn their way in by getting hot and winning their conference tournaments and allowing other teams to earn invitations by being consistently good throughout the season even if they were upset in a single game late in their conference tournament.

Seeding is presumably a quest for both fairness and drama, giving some teams advantages they’ve earned by being good but also allowing lower-ranked teams every opportunity to upset a higher-seeded team.

Who gets into the NCAA Tournament?

To begin, 32 teams earn automatic bids by winning their conference tournaments. Here’s a list of the 32 conferences that send their end-of-season tournament champions to the Big Dance. It’s who you’d expect, plus a whole bunch of conferences no casual fan will ever remember. So keep that link handy.

That leaves 36 spots for “at-large” teams, those that are invited by the NCAA Selection Committee according to some agreed-upon ranking system. The committee used to rely on the RPI, but the RPI is now RIP, and now the Committee uses the NET rankings.

This selection process ensures that the field consists of a mixture of teams: (1) those earning it over the course of a season, (2) power conference champions getting an opportunity to redeem an otherwise non-qualifying season by getting hot late and winning their conference tournament, and (3) mid-major teams that might not otherwise get in despite winning their conference tournaments just because they’re not in a power conference.

All the favorites get in, and the field leaves enough room for some Cinderella to become the belle of the ball.

Seeding

Once the 68 teams are chosen, the NCAA Selection Committee then determines the seeding of the participants. The bracket is divided into four regions, with each having 16 slots for teams.

First, the committee develops an “S-curve,” which is a ranking of all of the teams participating. Then, the committee seeds according to the S-curve and certain guiding principles.

The general rule of seeding

The top four teams on the S-curve are distributed among the four regions, each getting a No. 1 seed in its respective region. The regions themselves are “seeded” as well, meaning that they are organized so that if all of the No. 1 seeds made the Final Four, the best would play the worst and No. 2 would play No. 3.

After the No. 1 seeds are placed, the next four teams on the S-curve are distributed among the four regions, each getting a No. 2 seed. The process continues until all teams are placed into regions and seeded within them.

Guiding principles that override blind S-curve seeding

The Committee doesn’t assign the teams their seeds blindly according to the S-curve. Several principles can come into play to override that process.

Geography matters. Teams higher on the S-curve will generally get the most favorable region, geographically speaking. They can’t play on their home courts, though, until the Final Four, unless they are the University of Dayton. So, geography can impact your seed.

Unfamiliarity matters. Where and when possible, the Committee will generally attempt to avoid intra-conference matchups and other rematches from the regular season or the prior season’s tournament games, especially early in the Tournament. This generally means that teams from the same conference or that have recently competed against each other shouldn’t meet the first weekend of the tournament if it can be avoided.

The First Four. Four slots are reserved for teams winning the “First Four” games, and the rankings of these play-in teams can also throw a wrench into a purely mechanical seeding generated by the S-curve. The First Four games involve the four lowest-ranked at-large teams and the four lowest-ranked automatic bid teams. The winners of the games between the automatic bid teams are generally slotted in as No. 16 seeds, but the winners of games between the at-large teams are generally slotted in as No. 11 seeds, although they could also be lower.

Don’t get crazy. The Committee will attempt to comply with all of these principles by adjusting a team’s region or seeding, but they generally don’t want to change a team’s S-curve seed by more than one in either direction.

Homebrew bracketology

So, if you ever want to do your own bracketology, here’s how:

  1. Select the teams
    • Choose 32 teams by predicting the 32 conference tournament champions
    • Choose 36 others, according to highest NET ranking
  2. Develop the S-curve for the 68 participants (i.e., rank them according to NET rankings)
  3. Seed the teams according to the S-curve ranking, adjusting one seed up or down as needed to comply with the following principles
    • Give higher-rated teams on the S-curve a geographical advantage if possible
    • Don’t match up conference mates or teams that have played recently in the first round if possible
    • Assign automatic bid play-in winners 16-seeds
    • Don’t put at-large play-in winners above the 11-seed line

Tennessee-South Carolina Four Factors Forecast: Mostly sunny, except under their basket

UPDATE: This game has been moved to Wednesday.

Here’s the GRT Four Factors Forecast for Tennessee’s game against South Carolina tonight.

What to Watch

Oh, good: With the exception of offensive rebounding (see below), South Carolina is struggling in all of the key Four Factors. There are huge disparities between what the Vols generally do and what the Gamecocks generally do, and those disparities should result in a relatively comfortable Vols victory. Those differences are especially pronounced when the Gamecocks are shooting against the Vols’ defense, when the Gamecocks are trying not to turn it over to a thieving Vols squad, and when the Vols’ offense is forcing the issue and getting to the foul line.

But, but, but: Apart from the Vols’ own consistency problems, South Carolina is extremely active on the offensive glass and could earn a frustrating number of second chances and leverage them into a closer contest than it should be.

Score Prediction

Vegas has the Vols as 10-point favorites, and with an over/under of 142, the anticipated score should be something like Tennessee 76, South Carolina 66.

KemPom’s projection is Tennessee 75, South Carolina 65), which equates to an 83% chance of winning.

Our Hoops Statsy Preview Machine likes the Vols by 15 (Tennessee 78, South Carolina 63) with 10 comps and by 14 with all comps (Tennessee 80, South Carolina 66).

Details below.


Baseline

Current numbers:

The Vols are better everywhere except the offensive glass.

Four Factors: Straight-Up

Effective FG%

Conclusion: Among the Vols’ prior opponents, South Carolina is most like Cincinnati and Texas A&M. In other words, not especially good at getting the ball into the basket.

Turnover %

Conclusion: Similar story here; most like Cincinnati and Mississippi State, and not especially good.

Offensive Rebound %

Conclusion: This, however, is a very different story, as the Gamecocks are extremely good on the offensive boards, currently tied with Georgia and not far off Mississippi State. In this category, South Carolina will be one of the three best we’ve played.

Free Throw Rate

Conclusion: And back to the other story. Not good at getting to the free throw line. Most like Colorado and USC Upstate.

Four Factors: Opponent impact

Effective FG%

Conclusions

Tennessee’s inconsistency on the offensive side of the court has produced a very mediocre effective shooting percentage. Fortunately, South Carolina’s defense shouldn’t make things worse tonight. On the other end, that is an absolutely huge disparity with a team that struggles to find the bottom of the net going up against a team that is very good at keeping you from doing it.

Turnover %

Conclusions

Each defense appears to have an advantage over its opponent’s offense when it comes to creating turnovers. Fortunately for the Vols, SC’s advantage is not nearly as pronounced as Tennessee’s, which is massive. Expect the Vols’ offense to turn it over some — especially if the Gamecocks ramp up the pressure and the traps — but also expect the Vols’ defense to go racing the other direction quite often after forcing a ton of turnovers themselves.

Offensive Rebounding %

Conclusions

As good as South Carolina is at grabbing offensive rebounds, their advantage over Tennessee’s defense on that end of the court isn’t as big as it is for the Vols on the other end. Make no mistake, expect to be frustrated at the number of second chance opportunities for Carolina. But Tennessee should have an opportunity to mitigate that problem by doing pretty much the same thing under their own basket.

Free Throw Rate

Conclusions

Okay. If they want to, tonight could be a good time for the Vols to re-establish themselves at the free throw line.

Go Vols.

What is the Four Factors Gameplan?

If you’re a regular here, you know that we often post a Four Factors Gameplan in advance of men’s basketball games. But why?

If you’re not familiar with the “four factors,” it’s essentially an analytical framework that boils the game of basketball down to four key categories:

  1. Shooting
  2. Turnovers
  3. Offensive Rebounding
  4. Getting to the foul line

Of these, shooting matters the most by far and is defined as a formula that results in a number known as effective field goal percentage. The remaining categories are in order of importance, but are only marginally more important than the one below them and are all much less important than shooting. That’s quite a dramatic oversimplification, so if you want the full explanation, check out the Dean Oliver four factors page. Even KenPom uses these four factors.

What’s in a Four Factors Gameplan?

A Four Factors Gameplan starts with a baseline of how each team is currently doing in the regular stats that relate most closely to the four-factors. These are field goal shooting percentage, three-point shooting percentage, turnovers per game, offensive rebounds per game, and free throw attempts per game. We also add in defensive rebounds per game for flavor and defensive shooting percentages when available and when we’ve had enough coffee.

After that, we’ll look at each of the four factors by ranking all of Tennessee’s prior opponents in each category and then adding the next opponent to see which prior opponent they are most like in that category. We add the Vols just to see how they compare to the upcoming opponent.

After that, we’ll compare Tennessee’s offensive four-factors numbers to the opponent’s defensive four-factors numbers in an attempt to determine whether any facet of the game might be more important than usual. From that, we’ll develop a one-paragraph summary of what to watch for and our own gameplan.

Often one or both of the teams will do something completely out of character and none of it will matter, but more often it turns out to be a fairly accurate forecast of how things end up playing out.

Magic Numbers: Free Throws and Turnovers

I don’t think the highs and lows quite qualify as a roller coaster, but Tennessee’s basketball season is definitely on a winding road. The hope, of course, is that this thing is still going up the mountain: the Vols were the 11th-best team in college basketball in the eyes of the selection committee on Saturday, before the loss to LSU. That followed a pair of statement wins over Kansas and at Kentucky the previous two Saturdays. It remains incredibly important this year to earn at least a #3 seed in the NCAA Tournament, ensuring you avoid Gonzaga and Baylor until at least the Elite Eight. The Zags, in particular, would now be at least an eight-point favorite over any team in the nation that isn’t Baylor via KenPom. And Baylor would be at least -5.5 on the non-Gonzaga field.

Despite what those two are accomplishing, inconsistency is still generally the theme. It comes with covid, and it comes with freshmen, though Tennessee’s most recent struggles have come from everyone else’s contributions while Keon Johnson and Jaden Springer move to the front. The Vols also have health issues, as Yves Pons was clearly at less than 100% at LSU and UT’s defense suffered for it.

Still, the Vols are third nationally in KenPom defense, and the schedule should provide some opportunity for retooling. A second date with Florida needs to be rescheduled, but the Gators represent the only NCAA Tournament team left on Tennessee’s schedule. The Vols’ five SEC losses – all Quad 1 – currently leave them in fifth place in the league, but KenPom projects them to fall just once more, with six losses good enough to finish tied for second.

The schedule should help. How can the Vols help themselves?

The good news: I don’t think we’re far away, and I don’t think we’re done getting better.

Points

  • When UT scores 65 or fewer points: 3-5
  • When UT scores 66+ points: 11-0

Offense is definitely the greater challenge, and while the freshmen have been good, this is still a work in progress. But when your defense is this good, this is the simplest way to explain it: so far, when the Vols score 66 points, they win.

Early on, Tennessee was able to beat Colorado (now #14 KenPom!) with just 56 points. That’s also how the Vols escaped against Mississippi State.

This number won’t do it alone: in four of Tennessee’s five losses, 66 points wouldn’t have been enough. Alabama, Florida, Missouri, and LSU all scored in the 70s. But it’s a good starting point for success. And what’s been the most effective way the Vols have scored points?

Free Throws

  • When UT shoots 65% or less at the line: 1-4
  • When UT shoots 66% or better at the line: 13-1

Tennessee leads the SEC in free throw rate. The freshmen both excel at drawing contact, and it’s still one of John Fulkerson’s real strengths as well. Throughout the year, getting to the line has been the steadying play for a struggling offense.

But you have to make them when you get there. In losses:

  • Alabama: 17-of-26 (65.4%)
  • Florida: 12-of-25 (48%)
  • Missouri: 13-of-21 (61.9%)
  • Ole Miss: 10-of-16 (62.5%)
  • LSU: 13-of-17 (76.5%)

So not the problem on the Bayou, but problematic everywhere else in defeat. I’m sure there’s a confidence factor that comes into play here too. The freshmen are the team’s best at getting to the line, but the worst among regular contributors once there: Springer is okay at 75%, but Johnson just 68.9%.

In part, I think what happened at LSU is you had a physical game with few whistles. That’ll happen again. The Vols have to figure out how to respond when they can’t get it at the line, and will continue to be vulnerable if they don’t take advantage when there.

If you really want to lean into the team’s strengths:

Forcing Turnovers

  • When UT’s opponent has 13 or fewer turnovers: 3-4
  • When UT’s opponent has 14+ turnovers: 11-1

Just as getting to the line is the strength of the offense, turning it over continues to be the strength of the defense. The Vols are 18th nationally and second in the SEC in turnover rate, getting one on 23.1% of opponent possessions. The Vols can win without it: Kansas had a season-low seven turnovers and got waxed. The Ole Miss game continues to go in the weird category, the exception to the 14+ rule with 17 from the Rebels in their win.

But the others, all NCAA Tournament teams, had between 10-13 turnovers against the Vols. That jumps out to me, and can jump-start Tennessee’s offense if the Vols can get that going again.

When the Vols force turnovers, getting to 66 points shouldn’t be a problem because they generate offense, and 66 points should be enough. When it’s not, Tennessee needs to clean up its free throw shooting. Beyond that, there’s still plenty of room for offensive improvement. There’s also the notion that shots will still fall: for what it’s worth, Shot Quality has the Vols shooting 3.4% under their expected average from three, second-highest among ranked teams. That means a Tennessee team shooting 34% from the arc is getting good enough looks to be shooting 37%.

Maybe something like that will come around, maybe not. But if the Vols continue to force turnovers and clean it up at the line, Tennessee will create plenty of opportunities for themselves.

Does the difference between a 1-seed and a 2-seed matter?

Is your favorite men’s college basketball team in contention for a 1-seed in the NCAA Tournament? Are you guarding your sanity by telling yourself that it really doesn’t matter if your team gets a 1-seed or a 2-seed? Well, go ahead and fret, friend, because it does matter.

Before we get into why the difference matters, I have to first speak some truth into your life with love: If you’re relying on the AP and Coaches Polls to determine where your team is going to be seeded come Tournament time, you’re doing it wrong. The media and coaches polls matter as much to college basketball as the points in Whose Line is it Anyway. Not only do they have zero impact on the crowning of the national champion, they’re not even considered by the all-important folks sending out the save-the-dates come March.

Nope. The only thing that matters in college basketball is getting into the Big Dance and getting a cushy spot in the bracket. And that’s not determined by the polls, but by the Selection Committee and the NET Rankings.

Do 1-seeds do any better in the Tournament than 2-seeds?

So how important is it for fans to root for a No. 1 seed?

Pretty important, as it turns out. Here’s a look at the seeds of the winners, the runners-up, and other Final Four participants since the Tournament expanded to 64 teams in 1985:

And here’s how all of that data breaks down into categories:

Whoa. A full 63% of the winners were No. 1 seeds, and there’s a huge drop off for 2-seeds, who won the whole enchilada only 14% of the time. The advantage of seeding for the rest of the Final Four field isn’t quite as pronounced, but it’s there, and it’s significant.

Sure, every once in a while some 11-seed will crash the party with a scrappy nun in tow and scare the pants off everybody, but usually, the final weekend features the No Surprises All-Star team. And more often than not, the team cutting down the net in April is one that was sitting pretty on the top line on Selection Sunday.

Tennessee-LSU Four Factors Forecast: Too close to call

Here’s the GRT Four Factors Forecast for Tennessee’s game against LSU tomorrow.

What to Watch

Challenges: LSU shoots as well as anybody the Vols have played, they don’t turn the ball over much, and they look like an even matchup on the offensive glass and at getting to the free throw line.

Happy thoughts: When you factor in the teams’ respective defenses, Tennessee does appear to have an advantage in most of the Four Factors categories, although each of those apparent advantages is pretty slight.

Score Prediction

The line isn’t out yet, but KemPom’s projection is Tennessee 74, LSU 73), which equates to a 54% chance of winning.

Our Hoops Statsy Preview Machine is more optimistic, liking the Vols by 8 (Tennessee 78, LSU 70) with 10 comps and by 6 with all comps (Tennessee 83, LSU 77).

Details below.


Baseline

Current numbers:

So that looks pretty even, except that their shooting offense is slightly better and Tennessee’s defense is quite a bit better.

Four Factors: Straight-Up

Effective FG%

Conclusion: These guys shoot even better than Georgia. Basically, they’re tied with the best-shooting team that Tennessee has played so far this season in Florida, to whom they lost.

Turnover %

Conclusion: Okay, so they don’t turn the ball over, either.

Offensive Rebound %

Conclusion: This basically amounts to decent on the offensive glass. Essentially the same as Florida and Tennessee.

Free Throw Rate

Conclusion: Well, crud. These guys are good across the board, including at getting to the free throw line. Let’s see what adding in the respective defenses does to the analysis.

Four Factors: Opponent impact

Effective FG%

Conclusions

The shooting analysis is essentially the same as it was for the Georgia game except that LSU is even better on both ends. The Vols should be able to have a decent afternoon shooting the ball, and they’re going to need that spectacular defense because LSU is a real threat to shoot well and put up points. The Vols do appear to be the better team in this category, but the difference isn’t nearly as pronounced as it has been for most previews.

Turnover %

Conclusions

Ugh, all of this stuff is way too close. What those numbers don’t know is that the book is out on the Vols, and opponents can crank up those turnovers numbers just by pressuring our ball handlers. The only possible solution to that I can think of is to try to get the ball to Keon and let him dribble around the traps as they’re coming and before they get there.

To make matters worse, LSU’s offense isn’t nearly as generous as Georgia’s. As with shooting, the Vols do appear to be the better team, but not by much.

Offensive Rebounding %

Conclusions

This could be an opportunity for the Vols. They are decent on the offensive glass, but LSU’s defensive rebounding isn’t up to the same standard as the rest of their game. On the other end, LSU has a similar advantage, but it is not as pronounced.

Free Throw Rate

Conclusions

Ugh again, too close to call for Tennessee getting to the line, and LSU could make some hay there.

Go Vols.

SEC Teams on the NCAA Seed Line

The committee will reveal their Top 16 this Saturday (12:30 PM CBS), a month and a day from Selection Sunday. As Wayne Staats points out, the original grouping usually holds up, for the most part. In 2018 the Vols were the top #4 seed in the first reveal, and ended up earning a #3 seed. In 2019 the Vols were the second #1 seed in the first reveal, and ended up just missing the top line as the top #2 seed.

With no geography involved this year, the individual team rankings will matter much more in the bracket (as in, the top #1 seed should be grouped with the bottom #2 seed, etc., with a few exceptions to keep the best teams from the same conferences separate). And for those dreaming of deep tournament runs, nothing matters more in 2021 than this: stay away from Gonzaga and Baylor.

The Zags and Bears are currently at least seven-point favorites against anyone else via KenPom; they’d be 12 point favorites against Tennessee. Earlier this year we talked about the value of earning one of the other #1 seeds to ensure you stayed away from those two. But as the Vols are looking to advance to just their second Elite Eight (and potentially the first Final Four), there’s still extreme value in staying off the #4 line, ensuring you wouldn’t see either of those two until at least the Elite Eight. If you get lucky and are placed in one of the other “regions”, great. But if not, at least you make some history before getting the chance to make even more against those two.

Outside the Zags and Bears, we expect the Top 16 to be dominated by the Big 10 & 12. Villanova and Houston would certainly have compelling cases, as does Virginia as the best of the ACC.

But the SEC is also making a strong case with its top three teams. In yesterday’s Bracket Matrix, Alabama was a #2 seed, with Missouri and Tennessee at #3. And in Bart Torvik’s predictive bracketology, the Vols and Tide are both on the #2 line, with Missouri at #5. And those three teams are finished playing each other in the regular season.

Getting three teams in the Top 16 on Selection Sunday would be a major win for the SEC, especially with no Kentucky in the mix. How far has the league come? Since expansion to 14 teams nearly ten years ago now, here’s how often the SEC has placed teams on the Top 4 lines in the NCAA Tournmament:

  • 2013: Florida (3)
  • 2014: Florida (1)
  • 2015: Kentucky (1)
  • 2016: Texas A&M (3), Kentucky (4)
  • 2017: Kentucky (2), Florida (4)
  • 2018: Tennessee (3), Auburn (4)
  • 2019: Tennessee (2), Kentucky (2), LSU (3)

In fact, in the last played tournament two years ago, Auburn and Mississippi State just missed the Top 16, both on the #5 line.

While Arkansas and LSU try to stay on the right side of the bubble, don’t discount Florida either: the Gators are currently a #7 seed in the Bracket Matrix, but have games left with Arkansas, Missouri and, if rescheduled, Tennessee. The league should be able to get six teams in the field, but the three (maybe four) teams at the top can be about as good a group as we’ve seen since expansion. The league continues to trend in the right direction in basketball, and Tennessee continues to be a big part of it. Getting to a #3 seed or higher means your season doesn’t end via Gonzaga or Baylor without making some history first. And with Saturday’s performance still fresh in our minds, Tennessee’s expanding ceiling suggests they’ll very much belong in the Top 16.

Tennessee-Georgia Four Factors Forecast: Buckets, steals, and o-boards

Here’s the GRT Four Factors Forecast for Tennessee’s game against Georgia tonight.

What to Watch

Challenges: The Bulldogs tend to hit a high percentage of their shots. In addition, they are exceptional on the offensive glass, and they know how to create chaos by forcing turnovers.

Happy thoughts: Although they’re generally active in the thievery trade, the Bulldogs must have a guilty conscience or something, because whatever they steal, they tend to give back with interest. Also, Georgia’s less-than-stellar defense should mean a decent shooting night for a Tennessee team still lacking consistency in that department.

Score Prediction

Vegas has Tennessee as a 12.5-point favorite, and with an over/under of 140.5, a score prediction of something like Tennessee 76, Georgia 64.

KemPom’s projection is exactly that (Tennessee 76, Georgia 64), which equates to an 87% chance of winning.

Our Hoops Statsy Preview Machine likes the Vols by 10 (Tennessee 75, Georgia 65) with 10 comps. Using all games as comps, it predicts a higher-scoring game and a bigger margin for the Vols: Tennessee 84, Georgia 71.

Details below.


Baseline

Current numbers:

Hmm. These guys can shoot, and they get a fair amount of offensive rebounds. They don’t really defend very well, though, and they like to give the ball away.

Four Factors: Straight-Up

Effective FG%

Conclusion: Like I said, these guys can shoot. They’re not quite up to the standard of Colorado and Florida, but they lead the pack of Vanderbilt, Alabama (gulp), Arkansas, and Missouri.

Turnover %

Conclusion: Free turnovers!

Offensive Rebound %

Conclusion: Ugh. Elite-level offensive rebounding for the Bulldogs. Our hearts don’t generally get pierced by o-boards (but see Ole Miss), but that’s something to watch for sure.

Free Throw Rate

Conclusion: Okay, not bad. Among prior Vols’ opponents, Georgia is most like Vanderbilt and Ole Miss at getting to the line.

Four Factors: Opponent impact

Effective FG%

Conclusions

The Vols sometimes shoot well and sometimes don’t. Fortunately, Georgia’s defense should pave the way for a “sometimes shoot well” night.

On the other end, the Bulldogs usually shoot pretty well, but will be going up against an octopus with boa constrictors for appendages, so it could be tougher sledding than usual. Yes, that sentence includes a sea creature, a snake from the American West, and the elements and transportation indigenous to Anchorage. You’re welcome.

Turnover %

Conclusions

Well, shoot. The Bulldogs know how to force turnovers, too. Let’s just give the ball to each other and see who wins!

Fortunately, Georgia’s offense is much more generous than the Vols’. The odd thing is that the Bulldogs go to all that trouble to pull off a spree of exceptional heists but then just leave the valuables on the front lawn at night. But we’ll take it.

Offensive Rebounding %

Conclusions

Ooh, look at all of those second chances for both teams.

Free Throw Rate

Conclusions

Advantage, Tennessee, although the Vols are fouling much more now than they were earlier in the season.

Go Vols.

Tennessee 82 Kentucky 71: The Ceiling

Tonight was 20 minutes of everything you hate about Rupp Arena, then eight minutes of a really good basketball game, then 12 minutes of absolute joy.

If you watched, you don’t need much analysis on the foul situation early. Six Tennessee players had two fouls in the first half, including John Fulkerson in less than three minutes. Kentucky shot 13-of-15 at the line by halftime and built a 42-34 lead, the most points any team scored on the nation’s number one defense in any half this year. Different Rupp, same -erees.

Which just made it all the more fun to win anyway.

The Vols and Cats traded blows to open the second half, with what felt like a thousand possessions where one team would score and the other answered immediately. This time Tennessee found its way to the bonus early, but was still down 10 with 12 minutes to go. It seemed like the game had settled into a really nice flow.

And then it became one-way traffic.

Down ten with 12 to play, the Vols tied it up in less than three minutes. Keon Johnson and Jaden Springer hit four free throws around a score from Keon, then Yves Pons scored twice inside to tie it.

Keon again gave Tennessee the lead, then that really good basketball game broke out again for a minute. Kentucky scored four straight to retake the lead, then Keon Johnson did this:

He tried it again a minute later in a tie game, but was rejected on a sensational play by Davion Mintz. No worries: right back to Keon, who was fouled again, and knocked down two to put the Vols back in front 66-64 with 6:27 to play.

They wouldn’t trail again.

In a role reversal from Tuesday night in Oxford, Kentucky’s guards turned it over on consecutive possessions, and Tennessee suddenly had a six point lead. And with so much talk about the offense tonight – rightfully so – Tennessee’s defense kept Kentucky on 64 points for more than four minutes down the stretch. When the Cats cut it to eight with 1:54 to go, the Vols drained the shot clock, and Keon Johnson found Santiago Vescovi, who buried a three.

If you didn’t see it, just watch the last 12 minutes on a loop. From down 58-48 at that point, Tennessee closed on a 34-13 run to win by 11.

And if you didn’t see it, I’m not sure my or anyone’s words could do justice to what we saw from the freshmen tonight.

Fulkerson played less than three minutes in the first half and ten in the game with four fouls. He didn’t score, though he got plenty at Rupp last year. Vescovi’s dagger three? His only points. Yves, who hit those two big shots inside to bring it back even at the seven minute mark? Those were four of his six points.

Credit Victor Bailey for hitting enough shots to prevent a rout in the first half, where Tennessee also got some quality minutes from E.J. Anosike and Uros Plavsic. Credit Josiah-Jordan James for his first double-double, 10 points and 10 boards.

And when you envisioned what two five stars might do in the lineup at the same time? Tonight was that night.

After Pons scored back-to-back to tie it at 58-58, Keon Johnson and Jaden Springer scored Tennessee’s next 18 points. That’s everything from tie game to Vescovi’s dagger.

Jaden Springer had 23 points, five rebounds, and three blocks. Keon Johnson had 27 points, four rebounds, and three assists. Springer hit one three. Keon didn’t hit any. Go to the rim, baby. (And hit free throws, where a sometimes unsteady Keon hit 9-of-11.)

I said earlier I didn’t think anything about the Ole Miss loss changed my view of Tennessee’s ceiling, though it certainly made me look twice at the floor.

This tonight was a ceiling win.

There are seven games left (eight if they reschedule South Carolina), and if they’re over their own covid issues, Florida will present an immediate second opinion Wednesday night in Knoxville. There’s still more to see. But if what Tennessee got from its freshmen tonight can be duplicated, that ceiling might need some work. And if those freshmen become reliable first and second options, it might also help John Fulkerson’s game re-establish itself.

There’s more to watch, but tonight might’ve been the only chance to see Johnson and Springer at Rupp Arena. If so, “Remember that time those two freshmen had their coming out party?” goes right alongside, “Remember that time Fulkerson scored 27 up there?” Because now, after winning four times in Lexington in the first 40 years of Rupp Arena, the Vols have won three of the last four. And Rick Barnes is 8-5 against Kentucky at Tennessee.

It’s a weird year, new football coach, basketball team lost more games than you thought they might’ve to this point. But you don’t miss any chance to celebrate beating Kentucky. Once upon a time, in many of our lifetimes, we beat Alabama seven years in a row in football. This, in my lifetime, is as good as it’s every been against our biggest rival in basketball. Don’t miss it. Don’t waste it. Celebrate it, and then let’s get them again two weeks from today.

And that ceiling…you might want to look again.

Go Vols.