In 2016 the Vols were one of the most explosive teams in the country: 79 plays of 20+ yards, 19th nationally. In 2017, the bottom fell out hardest here: only 38 plays of 20+ yards, 123rd nationally.
Here too, progress was slow but accounted for last season: 52 plays of 20+ yards, 96th nationally. But remember, Tennessee ran fewer plays than any team in the nation last year. So those 52 explosive plays represented a higher percentage of the whole.
In fact, in the passing game the Vols were really good in their ratio of explosive plays to total passing attempts. In the post-Fulmer era, Jarrett Guarantano’s 7.8 yards per attempt trailed only Tyler Bray (8.3 in the last five games of 2010, 8.0 in 2011 and 2012) and Josh Dobbs in 2016 (8.3). And the percentage of big plays was even higher last season.
Here’s the percentage of 20+ yard passing plays in Tennessee’s total passing attempts this decade:
| Season | Passing Att | 20+ | % |
| 2018 | 297 | 39 | 13.1% |
| 2017 | 319 | 25 | 7.8% |
| 2016 | 379 | 50 | 13.2% |
| 2015 | 371 | 36 | 9.7% |
| 2014 | 453 | 44 | 9.7% |
| 2013 | 344 | 32 | 9.3% |
| 2012 | 477 | 53 | 11.1% |
| 2011 | 400 | 29 | 7.3% |
| 2010 | 419 | 54 | 12.9% |
(Stats via Sport Source Analytics)
Guarantano (with a small assist from Keller Chryst) connected on big plays in the passing game at a better rate than any Vol squad other than the 2016 offensive juggernaut. Those numbers don’t include sacks as passing attempts – Vol QBs went down on about 7% of drop backs – but Tennessee was still potent in the passing game, thanks in part to the work of Marquez Callaway, Jauan Jennings, and Josh Palmer on the other end of the play. Palmer’s 21.04 yards per catch were the most by any Vol this decade with 20+ receptions in a season; Callaway’s 16 yards per catch trailed only Josh Malone in 2016 (19.44), Cordarrelle Patterson in 2012 (16.91), and Denarius Moore in 2010 (20.87) among those with 35+ receptions in a season.
The Vols may not want to go fast, but they have all the tools to go big in the passing game, including what should be an improved offensive line.
Explosiveness in the running game, however…here’s the percentage of 10+ yard running plays in Tennessee’s total rushing attempts this decade:
| Season | Rushing Att | 10+ | % |
| 2018 | 419 | 49 | 11.7% |
| 2017 | 413 | 46 | 11.1% |
| 2016 | 517 | 85 | 16.4% |
| 2015 | 617 | 95 | 15.4% |
| 2014 | 524 | 61 | 11.6% |
| 2013 | 460 | 69 | 15.0% |
| 2012 | 413 | 51 | 12.3% |
| 2011 | 392 | 30 | 7.7% |
| 2010 | 408 | 50 | 12.3% |
As you’d expect: slightly better than 2017, but in a group of sub-par performances that only top 2011, when the Vols had no passing game to keep defenses honest after Tyler Bray’s injury.
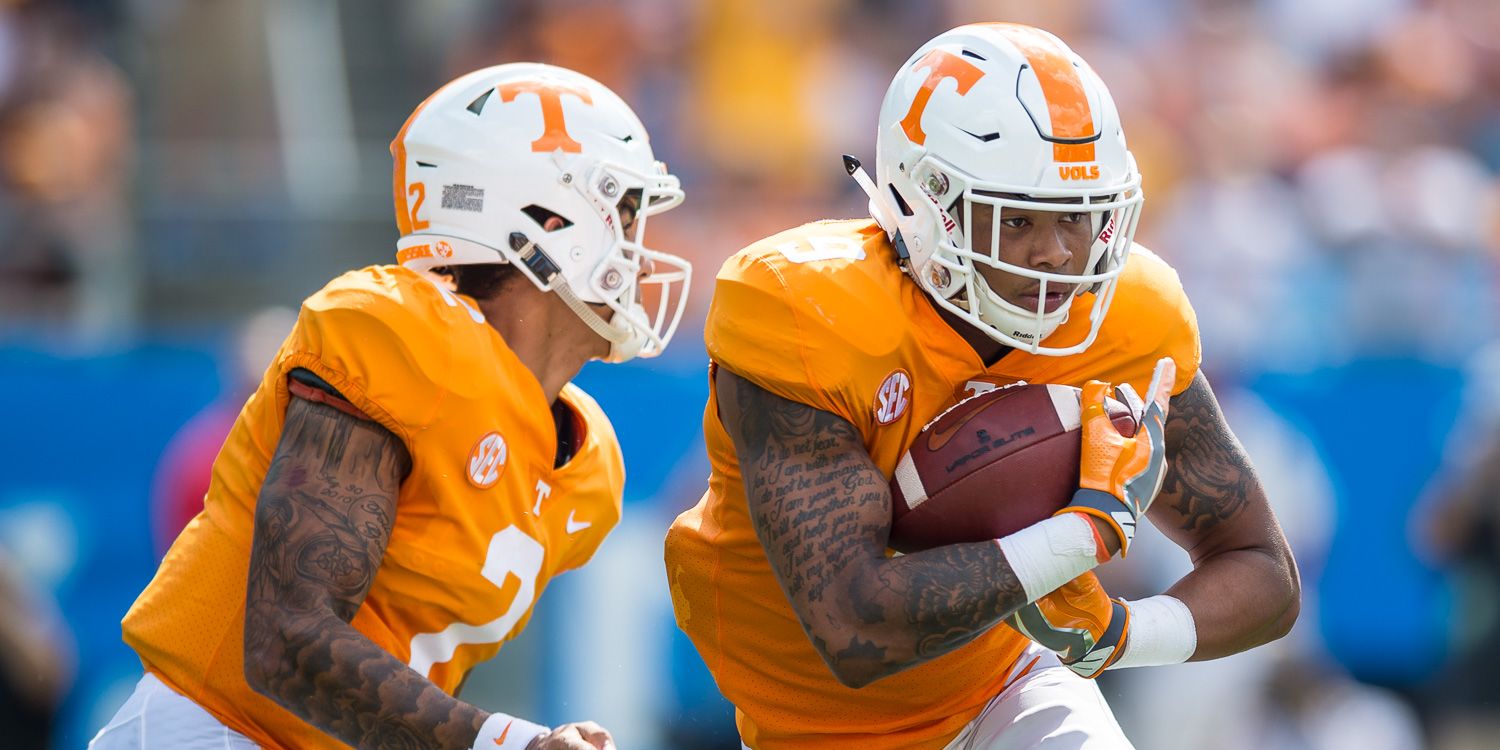
Ty Chandler got hot late in the season and finished with 5.48 yards per carry. But Tim Jordan actually carried the ball most (132 attempts to 115 for Chandler), and his 3.95 average was the lowest for the lead back since Tauren Poole’s 3.71 in that 2011 season. Tennessee’s additional options to find balance created few sparks: Madre London had 206 yards on 42 carries (4.90 per), Jeremy Banks 185 yards on 52 carries (3.56 per).
An improved offensive line should help here, and Eric Gray could provide those needed sparks to assist Chandler and Jordan. Could the Vols use the passing game to set up the run more in 2019? With Pruitt’s conservative nature, that will be interesting to watch. But with the right combination of existing pieces, new faces, and a willingness to pursue more big plays, Tennessee’s offense could show significant improvement in this department.