After Guarantano, Which Vol is Hardest to Replace?

You always start with the quarterback when doing the ominous summer piece on who you can least afford to lose. And Guarantano fits that bill, with unproven options behind him and untapped potential in front of him.

It’s more fun to think of this conversation in terms of replacement value. There are plenty of players we know will be valuable to the 2019 Vols, but many of the names that immediately come to mind play positions where depth is on Tennessee’s side: Marquez Callaway and Jauan Jennings, Alontae Taylor and Bryce Thompson, and maybe even Emmit Gooden and Aubrey Solomon. We also don’t know what version, if any, of Trey Smith we’ll get until we see him out there.

You have to look beyond Tennessee’s biggest names on offense, and many of them on defense. I do think you can make a case for Darrell Taylor; his eight sacks last year were the most for any Vol this decade other than Derek Barnett and Curt Maggitt, and his performance against ranked foes from Georgia and Kentucky definitely turned heads. Phil Steele lists him as the number four draft-eligible outside linebacker and a fourth-team All-American. The Vols are especially deep at linebacker, including some of their most exciting freshmen. But if Taylor simply proves to be that much better than the rest of that group, it’s good news for the Vols.

Still, I might through another name out there for most difficult to replace, at least in theory: Dominick Wood-Anderson.

The unrealistic expectations we tend to put on high-profile newcomers were just that for him last season: 17 catches for 140 yards and a pair of touchdowns. He was the number six option in the passing game last season. Likewise, the expectations we might have for Jim Chaney and tight ends may also be unfounded.

But if the Vols do find a spark getting Wood-Anderson involved this time around, it could get really thin behind him.

Tennessee’s only other returning reception by a tight end was a memorable one: Austin Pope against the Gators. I really want something good to happen to that kid. Behind him, it’s a bunch of unknowns, including four-star freshman Jackson Lowe.

The Vols might find something really good with Wood-Anderson this fall. If they do, he’ll instantly become one of the most valuable players on the team, in part because the options to replace him are so unproven.

Who else might be on the hardest-to-replace list?

Grant Williams to the Boston Celtics!

In 1996, the Boston Celtics selected Tennessee’s Steve Hamer in the second round, 38th overall. The Celtics hadn’t made the playoffs the previous three seasons; the Vols hadn’t made the NCAA Tournament in seven years. Hamer averaged 2.2 points per game on the worst Celtics team in history in 1997, and that was it.

It’s a rare and special thing when the pro team you love takes a Tennessee Vol. The only one that really stands out for me is the Titans taking Albert Haynesworth in 2002, which worked out well for all involved. Others have made their way to my favorite teams like Travis Henry and R.A. Dickey. But getting a player you love on a team you love from day one is special.

Williams, we all know, is special. Tennessee’s draft history is sparse since Hamer all those years ago. Ed Gray and Marcus Haislip went in the first round but didn’t stick around, and neither ascended to all-time Vol status while on campus. Tobias Harris is still fun to watch and is finally on a competitive team, but he was a one-and-done. Josh Richardson has become the leading scorer on a great franchise, but did it in continually-surprising fashion from the 40th pick in the draft.

I thought before tonight that Williams would have a chance to have the biggest day-one following for a Tennessee basketball player since Allan Houston. The Vols haven’t had great luck with their players going to NBA teams that are overly lovable: Haislip and Harris to the Bucks, Richardson to the Heat just after LeBron. Even going back to Dale Ellis, who started in Dallas then went to Seattle, NBA Vols haven’t stuck in regionally-friendly environments. Jarnell Stokes had a chance in Memphis but it didn’t work out.

So in this way, Grant Williams and Allan Houston are again similar: Houston went to the Detroit Pistons in 1993, when they still had Dumars, Isiah, and Laimbeer on the roster. For some of us, those guys were hard to like. Likewise, some of you won’t get the warm fuzzies about Grant going to the 17-time world champs; the Celtics inspire strong feelings.

But – if Williams sticks and isn’t caught up in any Danny Ainge shenanigans – it’s a great opportunity. Believe me, the Celtics are ready for more guys who know their role and play it well, and Williams has a chance to help everyone around him get better. It was quite the dichotomy this year being a Celtics fan and a Tennessee fan. The one impossibly talented and a favorite to make the NBA Finals, collapsing under its own weight and chemistry issues. The other a team full of three-stars, imposing its will on college basketball and its heart on Vol Nation for the rest of our lives.

The Celtics can use more of guys like Grant Williams. And we already know how rare guys like Grant Williams truly are. You may not be able to love the Celtics, I get that. But I have no doubt you’ll continue to love Grant Williams, and I’m hopeful it will be in ways that inspire a little more green and white in Big Orange Country for years to come.

Man, this pick made me smile. Go Vols.

We’ve Made This Climb Before: What the Early 80’s Can Teach 2019

Tennessee is 67-70 in the last 11 years, a longer sub-.500 run in the modern era than we can find for any of the other 15 winningest programs in college football history. A more concrete way to look at it: the Vols haven’t finished a season in the AP Top 20 since 2007, sneaking in at #22 after bowl wins in 2015 and 2016. That 11-year drought is also the longest on record in the modern era for any of the 15 winningest programs (via Wikipedia):

TeamYears w/o Top 20 FinishSeasons
Tennessee112008-18
Nebraska82011-18
Florida81975-82
Michigan71957-63
LSU71989-95
Notre Dame61981-86
Oklahoma61994-99
Texas61984-99
Southern Cal61996-2001
Penn State62010-15
Miami62010-15
Ohio State51987-91
Alabama51954-58
Florida State52005-09
Georgia41993-96
Auburn41976-79

The second-longest drought among these teams isn’t actually Nebraska’s current stretch: it’s also Tennessee, 10 years from 1975-84. So good news: the Vols have made this climb before. What Jeremy Pruitt is trying to dig out of is most similar to the challenge Johnny Majors faced in the early 1980’s.

When Doug Dickey left for Florida in 1969, Bill Battle took over and led the Vols to an 11-1 finish in 1970, the highest-rated Vol squad in estimated S&P+ of the last 50 years. Tennessee went 10-2 in 1971, then 25-9-2 in Condredge Holloway’s three seasons at quarterback. The Vols finished in the Top 20 in each of Battle’s first five seasons.

But the Vols went 7-5 in 1975 and 6-5 in 1976, ran their losing streak to Alabama to six straight, and Battle was replaced with native son Johnny Majors fresh off his national championship at Pittsburgh.

Majors’ first four Tennessee teams had a combined record of 21-23-1 and only one bowl appearance. If you’re just looking at wins and losses, his fifth team in 1981 appears to have broken the trend with an 8-4 season. But estimated S&P+ rates that team as the second-worst of the last 50 years behind 2017. Here’s a closer look at Majors’ first five seasons:

WLTPts ForPts Againstvs RankedOne Poss.
19774702292290-31-2
19785512512090-30-0-1
19797503112351-21-2
19805602561891-40-3
19818402442650-36-0

Going 6-0 in one possession games (including 24-21 over Wichita State and 38-34 vs Vanderbilt) is a great way to mask a negative point differential. In reality, these first five years should be grouped together as the downturn before we start talking about Tennessee’s slow and steady ascent.

If 1981 was a relative bottom from a competitiveness standpoint, the Vols made incremental progress every year from there. This too didn’t always show up in the win column, but you can see it in the point differential:

WLTPts ForPts Againstvs RankedOne Poss.
19826512812391-0-13-3-1
19839302821652-23-1
19847413272760-34-2-1

(On the strength of the 1983 defense: see White, Reggie.)

In estimated S&P+ percentile, the Vols went from 35.63 in 1981 to 55.46 to 80.07 to 87.26 in 1984. After a 1-2 start in 1983 with losses to #10 Pittsburgh and #11 Auburn, the Vols won eight of their last nine games and just missed running the table in a 13-10 loss to Ole Miss. Three of Tennessee’s four losses in 1984 came to ranked opponents, the fourth to a Kentucky squad that finished the season ranked.

Progress was there, though it might’ve been harder to see in the moment. I was born in 1981, so I can’t really speak to the personal experience of any of these years. But I can guarantee you what made everything better for Johnny Majors was beating Alabama.

The Tide won 11 straight from 1971-81. But Tennessee upset the #2 Tide 35-28 in 1982, Bear Bryant’s final season. In 1983 it was 41-34 over #11 Alabama in Birmingham thanks to a Johnnie Jones run. And in 1984 the Vols erased a 14-point deficit in the final nine minutes to win 28-27 in Knoxville.

When you get three straight against your biggest rival, everything else matters a little less. Consider how many Butch Jones sins are forgiven if the Vols beat Florida in 2014, 2015, and 2016 (and 2017, for that matter).

After going 29-27-1 (.518) from 1977-81, the Vols went 22-12-2 (.688) the next three seasons. Getting back to being a team that averaged 7-8 wins in an 11-game regular season was a big step. But at this point, the Vols had still gone 10 years without finishing in the AP Top 20.

The breakthrough came in 1985:

WLTPts ForPts Againstvs RankedOne Poss.
19859123251403-1-12-1-2

Not only did the Vols get four straight against Alabama, they dominated Bo Jackson and #1 Auburn 38-20. The Vols won the SEC and, of course, beat #2 Miami 35-7 in the Sugar Bowl, putting an emphatic end to a decade away from the national stage with a top five finish.

It took a little more time for that kind of finish to become commonplace. The Vols yo-yoed with a 7-5 finish in 1986, 10-2-1 ranked 14th in 1987, and 5-6 in 1988. But from there, Tennessee entered its longest stretch of sustained excellence: 129-29-2 from 1989-2001, a .813 winning percentage that was best in the SEC for those 13 years. With the exception of an obvious rebuild in 2000, the Vols played at the 88th percentile or better in estimated S&P+ for that entire stretch. The Vols played at the 87th percentile or below every year from 1975-84.

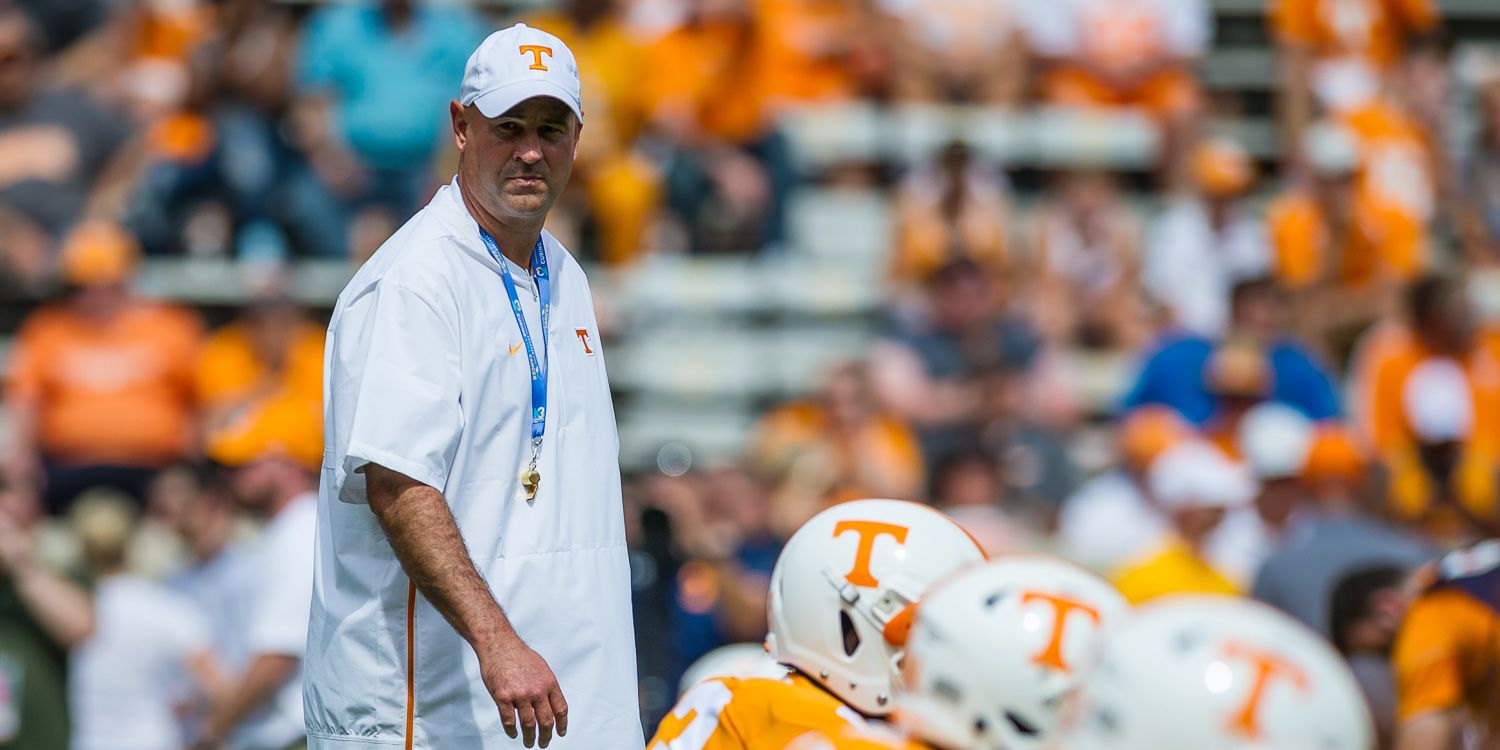
After last season, Tennessee’s drought in the postseason AP Top 20 reached 11 years, one more than that 1975-84 downturn. To be sure, the Vols seem farther away from a championship breakthrough in 2019 than they were in 1984. But Jeremy Pruitt and the Vols are already following that early 80’s blueprint:

WLTPts ForPts Againstvs RankedOne Poss.
20174802383490-42-3
20185702733352-31-1

2017 and 1981 are the two lowest seasons of the last 50 years in estimated S&P+ percentile; 2017 is far worse at 17.4%, but remember that 1981 team won six one-possession games. They’re not so dissimilar considering Butch Jones’ last team lost on the final play against Florida, South Carolina, and Kentucky.

So we’ve already seen the Vols make progress from the bottom. But like those early Majors teams, Tennessee had a hard time just getting in one-possession games last year. The trap Butch Jones’ teams fell into was believing being close was a good thing, playing far too many one-possession and even final-play games to escape a treadmill that topped out at 8-4. But for Jeremy Pruitt in year two, courting heartbreak via close games would look like progress. It can’t be confused for the destination – Pruitt’s time at Florida State and Alabama blowing teams up should assure he’s already learned that lesson – but it’s a step the Vols can take along the way.

Being gone longer than any other blue-blood program should remind us of the task at hand. But Tennessee’s climb in the early 1980’s – slow but steady – should remind us that such a feat can be accomplished at this university. It may not happen as fast as any of us want, but progress is both readily available and already underway. Keep recruiting and developing well. Get competitive but don’t settle for living there. Make 8-4 an average expectation and not something you have to rebuild after. And, you know, beat Florida.

Tennessee has a long way to go, perhaps longer than any other program with our past can appreciate. But the Vols have made this climb before, and came out of it with their very best days ahead of them. I’m eager to see what the next step will look like this fall.

Are we underrating or overrating the importance of Guarantano staying healthy?

There are plenty of scenarios we wouldn’t enjoy this fall – no playmakers emerge on the defensive line, freshmen don’t emerge to build hope for the future – but it’s probably fair to say nothing would impact Tennessee’s ceiling like losing Jarrett Guarantano for any length of time.

Some of that is the possibility of what Guarantano could be with another year under his belt. Tennessee’s starter was seventh among SEC quarterbacks in completion percentage, and higher than that before a banged-up 13-of-31 finish in the last two games. He finished sixth in the league in yards per attempt, and was one of only five quarterbacks in the nation to throw just three interceptions with 200+ passing attempts.

Some of that is the mystery of what’s behind him. This will be the fifth time this decade Tennessee’s backup quarterback(s) has never attempted a pass. Brian Maurer and J.T. Shrout could blossom into real options for the Vols in the future, but Tennessee’s best path in the present is for neither of them to take a meaningful snap.

In the post-Fulmer era, only Jonathan Crompton in 2009 and Josh Dobbs in 2015 & 2016 took every meaningful snap as the starting quarterback (throw in Tyler Bray in 2012 if you don’t count his in-game removal against Vanderbilt). In 2010 Bray took command in November as a true freshman.

But four times in the last eight years, Tennessee’s starting quarterback was lost to a multi-game injury: five games for Tyler Bray’s broken thumb in 2011, a combined ten missed starts for Justin Worley in 2013 and 2014, and a shoulder injury taking out Quinten Dormady for the second half of 2017.

From a history standpoint, the game has changed plenty in the last three decades, but consider how, with the exception of Jerry Colquitt’s tragic knee injury on the first drive in 1994, Tennessee’s starting quarterback took every meaningful snap from 1989-1999. A big part of all that winning was having Andy Kelly, Heath Shuler, Peyton Manning, and Tee Martin out there every Saturday. And in ’94 while the Vols worked Todd Helton, Manning, and Brandon Stewart into the mix, they could also hand the ball off to an NFL running back playing behind NFL offensive linemen. If the Vols have those pieces in 2019, we don’t know it yet.

It’s all of these variables – inexperienced backups, starter prone to getting hit, offensive line still young, and the simple math of QB’s anywhere struggling to take every meaningful snap – that cause concern. An injury to Guarantano would create a need for the pause button on Jeremy Pruitt, but that’s easier said than done. In 2011 Tyler Bray put on one of the best passing days of any Vol quarterback against Cincinnati, then got hurt weeks later (along with Justin Hunter) when things felt too far down the road to just say, “Well, this year shouldn’t really count,” effectively.

I think there’s talent on this team, young and old, that’s going to manifest itself this fall in ways that excite us. That can be true on the defensive side of the ball no matter what happens, and can show signs of progress even if the Vols lose their quarterback early in the year. But it does feel like an awful lot of the progress we want is tied into conversations about Guarantano working with this receiving corps for the last time.

It’s also tough to call a conservative game – at least in theory, since Tennessee did it plenty last year – when you’re still playing catch-up in the talent pool. Justin Worley got hurt both times because the Vols were playing to score points and make big plays, but couldn’t keep him upright long enough to do so against the best defenses in the SEC. Tennessee’s best football involves Guarantano, Callaway, and Jennings making a difference. That will involve, on some level, Guarantano facing pressure behind a young offensive line against great defenses.

It’s a fine line to walk, and it’ll be interesting to see how Pruitt and Jim Chaney choose to handle it. You can’t coach or play scared; I think the Vols have a chance to have a really good passing game. It may just require putting the most important piece of that puzzle at risk to earn that reward.

The Long Way Out of the Wrong Kind of History

Despite everything that’s happened the last 11 years, Tennessee is still 11th in winning percentage all-time, still second in the SEC behind Alabama. This is Tennessee’s historical DNA in both football and basketball: the first challenger to the thrones in Tuscaloosa and Lexington.

But Tennessee’s struggles from Phillip Fulmer’s final season through Jeremy Pruitt’s first are unique among their blue-blood brethren. I’m not sure any of the 15 winningest programs in college football history have seen a stretch of sub-.500 football in the modern era like the one Tennessee is currently enduring.

We already know 2017 was Tennessee’s worst season of at least the last 50 years, and not just in wins and losses: that season finishing in the 17th percentile in estimated S&P+ means Pruitt inherited a deeper hole than any of his current SEC contemporaries in year one. That appears to have been rock bottom, but as we know it took more than a one-year drop-off from 2016 to 2017 to truly get there.

From 2008-18, the Vols are 67-70. That .489 winning percentage is 73rd nationally in that span, better only than Kentucky (.457) and Vanderbilt (.428) in the SEC. Some Top 15 programs have hovered around .500 or even further below for several years in the modern era, but I couldn’t find any stretch of sub-.500 football for this long.

Before we spend some time looking at how the Vols have gotten out of similar holes (if not quite as deep and complex) in their own history, I wanted to see if there were comparisons with other historic programs. Here’s as close as I could reasonably come in search of those comparisons:

Oklahoma 1994-99

  • All-Time Winning Percentage: .724, fifth
  • 1994-99: 30-38-1

Oklahoma went 6-6 in Gary Gibbs’ final season, then hired Howard Schnellenberger. He went 5-5-1 in 1995, then resigned. They hired John Blake, who went 12-22 in three years. Then Bob Stoops went 7-5 in his first season. Of course, they won the BCS title in year two.

Southern Cal 1996-2001

  • All-Time Winning Percentage: .698, seventh
  • 1996-2001: 37-35

John Robinson won the Rose Bowl in 1995, but went 6-6 and 6-5 the next two years and was out. Paul Hackett came in and went 8-5, 6-6, and 5-7; Wikipedia notes it was USC’s first consecutive non-winning seasons since 1960-61. Pete Carroll went 6-6 in his first season. After that: 11-2, 12-1 and a title, 13-0 and another title.

LSU 1989-94

  • All-Time Winning Percentage: .652, 13th
  • 1989-94: 25-41

Mike Archer went 4-7 and 5-6 in his last two seasons. Curley Hallman went 16-28 over the next four seasons, never making a bowl game and leading a 2-9 squad in 1992. Gerry DiNardo was hired and went 7-4-1, 10-2, and 9-3 his first three seasons, but stumbled to 4-7 and 3-9 to close out the 1990’s. LSU hired Nick Saban and the rest is history.

So we’ve seen top-tier teams struggle as much or more than Tennessee in recent history, but only for about half as long. Programs like Oklahoma had unusual coaching turnover that contributed to the problem. While it’s difficult to duplicate Tennessee’s weirdness in the last 11 years, programs we might point to with similar circumstances both found their way out of it sooner and weren’t as bad for as long. Alabama had Mike DuBose in 2000, Dennis Franchione for two seasons, the infamous Mike Price hiring and firing, then Mike Shula to take over in 2003. But the Tide still went 53-40 on the field between DuBose’s final season and Saban’s first, though the official, post-violation record books have them at 32-46 in that span. Other programs had individual coaches that definitely didn’t work – Rich Rodriguez, Gerry Faust – but the next guy brought an upswing.

It’s obvious Butch Jones wasn’t that guy, but it’s still interesting to note how close he was to breaking Tennessee’s down cycle for at least one or two seasons. If the Vols stop Florida on any fourth down in 2015 to win the SEC East, and/or beat Vanderbilt to make the New Year’s Six in 2016, Jones would’ve been seen more like LSU’s DiNardo: not the guy long-term, but brought Tennessee back to tangible prominence for at least a moment and made life easier on the next guy. But you can’t really say the same thing about a pair of 9-4’s when they’re followed by the worst season of at least the modern era.

So we rightfully keep looking at the valley Tennessee has been in as a continuous walk for the last 11 years, with the sub-.500 football to prove it. If there’s a benefit here, it’s the way the length of the journey has forced healthier expectations upon us for Jeremy Pruitt’s second season. It wasn’t one bad hire or even six years away as was the case for Oklahoma, Southern Cal, and LSU. One great hire put a national championship in their hands in year two for Stoops, year three for Carroll, and year four for Saban. Given the length of Tennessee’s absence from that conversation, it should rightfully take a little more time to figure out if Pruitt is that kind of great coach, with other steps rightfully celebrated along the way.

Making Progress: Third-and-Short

We saved the worst for last. In our series on where Tennessee can make the most progress in 2019, we’ve explored:

But if you’re looking for the thing Tennessee was absolutely, positively worst at last season, it’s third-and-short.

Last year Tennessee ran the ball 21 times on 3rd-&-1-to-3. They gained just 20 yards. Those 0.95 yards per carry on third-and-short weren’t just last in the country: Liberty finished 129th, and averaged 1.52 yards per carry. The Vols were the only team in America to average less than a yard-and-a-half per carry on third-and-short, and the Vols averaged less than a yard period.

(Stats, as always, via SportSource Analytics)

Those 21 carries led to 10 first downs, meaning the Vols converted just 47.6% of the time when running the ball on third-and-short. By comparison, here’s what Tennessee did in other situations last fall:

AttFirst DownsSuccess Rate
3rd 1-3 Run211047.62%
3rd 1-3 Pass10440.00%
3rd 4-6 Run9222.22%
3rd 4-6 Pass281553.57%
3rd 7-9 Run7342.86%
3rd 7-9 Pass281346.43%
3rd 10+ Pass341132.35%

Statistically speaking, it was better for the Vols to be in 3rd-&-4-6 and pass than 3rd-&-1-3 and run. And Tennessee had more or less the same chance of getting a first down on a third-and-short run and a third-and-long pass.

The truth is, if you’re in third-and-short, you’ve done fairly well on first and second down. But Tennessee struggled mightily to convert from there. Here’s what the rest of the SEC did when running it on third-and-short:

AttYardsAvg1st DownsSuccess Rate
Georgia361885.222672.22%
Missouri451783.963168.89%
Florida421784.242866.67%
Texas A&M321404.382165.63%
Kentucky461563.393065.22%
Alabama431824.232865.12%
Mississippi State522815.403261.54%
Auburn452665.912760.00%
LSU491984.042959.18%
Arkansas20311.551155.00%
Ole Miss34932.741750.00%
Vanderbilt241134.711250.00%
Tennessee21200.951047.62%
South Carolina21512.43838.10%

Obviously, it would be hard to get much worse in this department. The good news is, because you’re already in a short yardage situation, a little improvement goes a long way toward keeping a drive alive. There may also be a stubbornness component here: I’d imagine Jeremy Pruitt/Tyson Helton had to see it several times to believe the Vols really couldn’t move the pile on third-and-short. Pruitt and Chaney are likely to believe it sooner if it happens again this fall.

Making Progress: Explosive Plays

In 2016 the Vols were one of the most explosive teams in the country: 79 plays of 20+ yards, 19th nationally. In 2017, the bottom fell out hardest here: only 38 plays of 20+ yards, 123rd nationally.

Here too, progress was slow but accounted for last season: 52 plays of 20+ yards, 96th nationally. But remember, Tennessee ran fewer plays than any team in the nation last year. So those 52 explosive plays represented a higher percentage of the whole.

In fact, in the passing game the Vols were really good in their ratio of explosive plays to total passing attempts. In the post-Fulmer era, Jarrett Guarantano’s 7.8 yards per attempt trailed only Tyler Bray (8.3 in the last five games of 2010, 8.0 in 2011 and 2012) and Josh Dobbs in 2016 (8.3). And the percentage of big plays was even higher last season.

Here’s the percentage of 20+ yard passing plays in Tennessee’s total passing attempts this decade:

SeasonPassing Att20+%
20182973913.1%
2017319257.8%
20163795013.2%
2015371369.7%
2014453449.7%
2013344329.3%
20124775311.1%
2011400297.3%
20104195412.9%

(Stats via Sport Source Analytics)

Guarantano (with a small assist from Keller Chryst) connected on big plays in the passing game at a better rate than any Vol squad other than the 2016 offensive juggernaut. Those numbers don’t include sacks as passing attempts – Vol QBs went down on about 7% of drop backs – but Tennessee was still potent in the passing game, thanks in part to the work of Marquez Callaway, Jauan Jennings, and Josh Palmer on the other end of the play. Palmer’s 21.04 yards per catch were the most by any Vol this decade with 20+ receptions in a season; Callaway’s 16 yards per catch trailed only Josh Malone in 2016 (19.44), Cordarrelle Patterson in 2012 (16.91), and Denarius Moore in 2010 (20.87) among those with 35+ receptions in a season.

The Vols may not want to go fast, but they have all the tools to go big in the passing game, including what should be an improved offensive line.

Explosiveness in the running game, however…here’s the percentage of 10+ yard running plays in Tennessee’s total rushing attempts this decade:

SeasonRushing Att10+%
20184194911.7%
20174134611.1%
20165178516.4%
20156179515.4%
20145246111.6%
20134606915.0%
20124135112.3%
2011392307.7%
20104085012.3%

As you’d expect: slightly better than 2017, but in a group of sub-par performances that only top 2011, when the Vols had no passing game to keep defenses honest after Tyler Bray’s injury.

Ty Chandler got hot late in the season and finished with 5.48 yards per carry. But Tim Jordan actually carried the ball most (132 attempts to 115 for Chandler), and his 3.95 average was the lowest for the lead back since Tauren Poole’s 3.71 in that 2011 season. Tennessee’s additional options to find balance created few sparks: Madre London had 206 yards on 42 carries (4.90 per), Jeremy Banks 185 yards on 52 carries (3.56 per).

An improved offensive line should help here, and Eric Gray could provide those needed sparks to assist Chandler and Jordan. Could the Vols use the passing game to set up the run more in 2019? With Pruitt’s conservative nature, that will be interesting to watch. But with the right combination of existing pieces, new faces, and a willingness to pursue more big plays, Tennessee’s offense could show significant improvement in this department.

Early Bowl Projections Expect Vols to Make Reasonable Progress

Magazines are hitting shelves – get ours here! – and with them an early round of bowl projections for Tennessee. The good news: I haven’t seen the Vols projected to come up empty in the postseason yet, nor have I seen Tennessee projected to spend December in Birmingham or Shreveport.

It’s all an educated guessing game at this point; a couple of outlets have the Vols projected to the Belk (247) and Gator (Sporting News) Bowls. But these two and their SEC group of six counterparts – the Outback, Music City, Liberty, and Texas bowls – are reasonable destinations for Tennessee this fall. Any bowl appearance would be progress by definition, but an expectation for the Vols to get back in this group of six tier comes with a ceiling at its top in Tampa, or just beyond it in Orlando.

The first question to ask when making these projections is, “How many SEC teams do you think will make the College Football Playoff & New Year’s Six?” In the first five years of the playoff, the SEC put 14 teams in those two tiers, an average of 2.8 per year. With the semifinals in Atlanta and Tempe this year, the Sugar Bowl will automatically take the highest-rated SEC team not in the playoffs; that means at least two from this conference off the board if you expect Alabama to make it six-for-six in the CFP. Last season we saw a record four SEC teams come off the board before the Citrus Bowl, with the Tide in the playoff and LSU, Georgia, and Florida all in the New Year’s Six.

The Citrus Bowl picks next, then the league office works with schools and bowls to “assign” teams to the group of six games. Here’s how all of that has looked since the playoff began in 2014:

20142015201620172018
AlabamaCFPCFPCFPCFPCFP
ArkansasG6G6G6
AuburnG6OtherNY6NY6G6
FloridaOtherCitrusG6NY6
GeorgiaG6G6G6CFPNY6
KentuckyG6G6Citrus
LSUG6G6CitrusCitrusNY6
MississippiNY6NY6
Mississippi StateNY6G6OtherG6G6
MissouriCitrusG6G6
South CarolinaOtherOtherG6G6
TennesseeG6G6G6
Texas A&MG6G6G6G6G6
VanderbiltOtherG6

If the SEC gets three teams in the CFP and New Year’s Six, and the fourth team goes to the Citrus Bowl, the Vols or anyone else would just need to be considered one of the ten best teams in the league to make a group of six bowl. Seeing Tennessee routinely projected in this group suggests an expectation the Vols won’t just sneak in at 6-6, but fall in line with their Vegas projection of 7-5.

We wrote on the value of 7-5 a few weeks ago, but the bowl game adds another layer of context. If the Vols hit their Vegas number and win the bowl game, an 8-5 finish would be the third best season of the last 12 years:

  • 9-4: Butch Years 3 & 4
  • 8-5:
  • 7-6: Kiffin, Butch Year 2
  • 6-7: Dooley Year 1
  • 5-7: Fulmer Final Year, Dooley Years 2 & 3, Butch Year 1, Pruitt Year 1
  • 4-8: Butch Year 5

The relative value of 7-5 would depend on which seven and which five, but should easily slide the Vols into a group of six bowl for a shot at a nice aftertaste. That continues to look like a reasonable expectation for Tennessee this fall.

Making Progress: Red Zone Defense

Here are Tennessee’s stops in the red zone last season:

  • Alabama went for it on fourth down up 58-21 with four minutes left
  • South Carolina took a knee in the red zone at the end of the game
  • Kentucky had a field goal blocked with the Vols up 24-7 with 12 minutes left
  • Vanderbilt missed a field goal leading 17-7 early in the third quarter

And that’s it.

Opponents converted 41 of 45 red zone opportunities against the Vols last year, 91.1%, and only two of those four stops came in meaningful situations. That scoring percentage ranked 120th nationally last fall. Opponents scored touchdowns 30 times in those 45 trips; a 66.7% red zone touchdown percentage ranked 90th nationally.

(stats via SportSource Analytics)

As you might expect, the Vols were bad at this in 2017 too: 50 red zone visits, only five stops. Tennessee also gave up 35 touchdowns in those visits; 70% is Tennessee’s worst red zone touchdown percentage of the decade.

But it’s also a stat the Vols haven’t excelled at in a long time. In 2015 Tennessee held teams to a 56.1% touchdown percentage, but gave up seven touchdowns in eight visits against Oklahoma and Florida, setting a tone that was hard to forget. In 2014 Tennessee allowed only 34 red zone visits, but gave up points 32 times. You have to go back to teams with Fulmer’s final recruits on them to find more success: a 45.5% touchdown percentage in 2009, 52.1% with a 79.2% scoring percentage in 2010.

A note of interest for 2019: on offense, last year Mississippi State led the SEC in red zone touchdown percentage at 69.1%; BYU was slightly better at 69.2%. Those two teams don’t strike the same extreme fears as some of Tennessee’s recent non-conference and cross-divisional opponents, but both were incredibly efficient in the red zone.

If last year was about getting out of the basement, consider the progress available if Tennessee just moves toward average football in some of these key categories. Last season the Vols moved from rankings in the 120’s to rankings in the 80’s and 90’s in many categories. The median for turnovers forced last year was 19; Tennessee forced only 15. The median for red zone scoring percentage allowed was 83%, with a 60% touchdown percentage. If the Vols can just get from 91% and 67% to those average numbers, it can make a real difference in close games.

One big question for both turnovers and stops in the red zone: who are the playmakers on defense? The Vols will need more than Darrell Taylor and their sophomore corners to make a meaningful difference here.

Making Progress: Pace and Balance

No team in the country ran fewer plays than Tennessee last season.

The Vols had 716 snaps in 12 games, 59.7 per contest. Maryland was next with 728 snaps. Tennessee also flirted with last place in this category in 2017 – 732 snaps, 125th nationally – but the offense did make strides from one year to the next. The Vols ran fewer plays for the reasons you’d expect in 2017, but were better in all of those categories last fall:

2017Rank2018Rank
Yards Per Play4.771205.4688
Punts Per Game5.9235.533
Third Down %30.7%12038.2%74
Time of Poss.28:1410429:1086
Turnovers18481630

(stats from SportSource Analytics)

The offense improved, but the pace slowed even more. I wouldn’t expect Tennessee to lead the league in total plays under Jeremy Pruitt, no matter who the offensive coordinator is. But we speculated throughout last fall if Tennessee was going slow on purpose, for protection of its defense or otherwise.

It was often easiest to arrive at that thought on first down. Last year the Vols attempted only 95 passes on first down, 119th nationally. Most of what’s behind them are service academies, Georgia Tech, and other option teams. Unlike some of those teams, the Vols played from behind for significant minutes against half of their schedule.

Running on first down could still bear fruit: Tennessee averaged 4.46 yards per carry on 1st-and-10, up from the 3.70 yards they averaged per carry overall. We’ll talk more about this when we get to what the Vols did on 3rd-and-1 in this series. But Tennessee’s 219 first down carries gave them a run/pass ratio of 69.7% on first down.

What kind of difference will Jim Chaney make? One of his greatest strengths is adapting the offense to the talent around him. With Tyler Bray in 2012, the Vols ran the ball just 55.8% of the time on first down. With Nick Chubb and Sony Michel in 2017, Georgia ran the ball a whopping 77.3% of the time on first down. The 2017 leaderboard of first down rushing attempts: Georgia, Air Force, Army, Navy.

In some ways we’ll just need to see it before saying how exactly the Vols will/should go faster in 2019. If Pruitt was, in fact, trying to protect his defense last fall, will it need the same protection this year with an entirely new defensive line? If the offense can excel with plenty of returning pieces and Chaney’s leadership, will the Vols intentionally engage in faster play and more points? There’s no guarantee the one will lead to the other: last year Tennessee’s most efficient day at the office came against Kentucky, where the Vols averaged 6.87 yards per play in just 60 snaps. But the season highs (79 plays vs Florida) and lows (46 at Georgia) produced the two least efficient days against power conference foes: 4.61 yards against the Gators, 4.54 against the Dawgs.

The Vols need to go a little faster with a little more balance on first down. How much more of each will represent their best football in 2019? Stay tuned.