Here’s our weekly color-coded look at how the Vols’ national rankings are trending in each of the official NCAA stat categories.
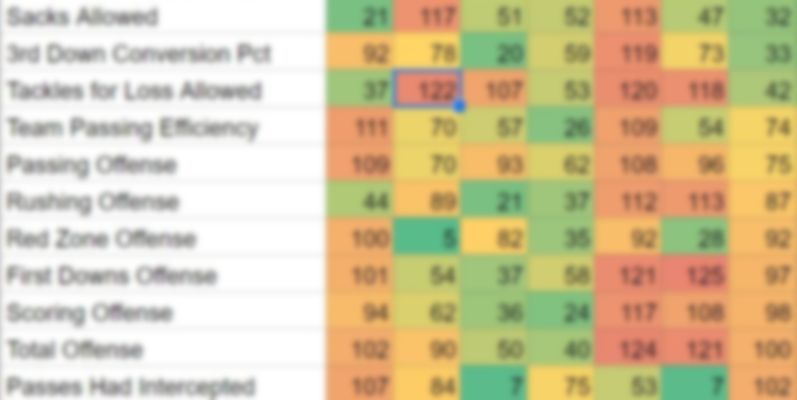
Offense
If the table above doesn’t display well, try using this link.
Currently doing well: Nope
Took a hit this week: 4th down conversion percentage, tackles for loss allowed
Currently needs improvement: Pretty much everything, but let’s start here: 3rd down conversion percentage, total offense, scoring offense, passing offense, passing yards per completion, rushing offense . . . you get the idea
Improved this week: Nope
Defense
If the table above doesn’t display well, try using this link.
Currently doing well: Defensive TDs, 4th down conversion percentage defense
Took a hit this week: Total defense, which is to be expected after playing a historically good offense, and passing yards allowed. Also, pretty much everything else got worse as well, which again, is to be expected.
Improved this week: Nope
Currently needs improvement: As with the offense, it’s a long list, but should start with 3rd down conversion percentage defense (and a host of other stuff)
Special Teams
If the table above doesn’t display well, try using this link.
Currently doing well: Punt returns, punt return defense, kickoff returns
Took a hit this week: Punt return defense went from No. 2 to No. 18; net punting fell again, this time from No. 24 to No. 31.
Improved this week: Nope
Currently needs improvement: Kickoff return defense, again
Turnovers and Penalties
If the table above doesn’t display well, try using this link.
Currently doing well: Fumbles recovered
Took a hit this week: Major downward trends this week in these categories are fewest penalties, fewest penalties per game, and fumbles lost.
Improved this week: Nope
Appears to need improvement: Turnovers